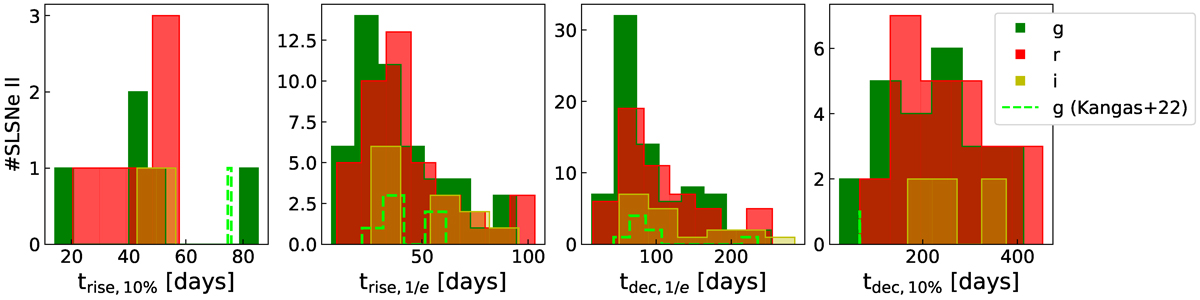
Fig. 4.
Download original image
gri band (green, red, and yellow, respectively) distribution of trise, 10% (first panel), trise, 1/e (second panel), tdec, 1/e (third panel) and tdec, 10% (last panel). Empty, dashed lime steps show the corresponding parameter distribution of the ZTF SLSN II sample presented by Kangas et al. (2022), see Sect. 5.1 for a discussion.
Current usage metrics show cumulative count of Article Views (full-text article views including HTML views, PDF and ePub downloads, according to the available data) and Abstracts Views on Vision4Press platform.
Data correspond to usage on the plateform after 2015. The current usage metrics is available 48-96 hours after online publication and is updated daily on week days.
Initial download of the metrics may take a while.