Fig. A.6.
Download original image
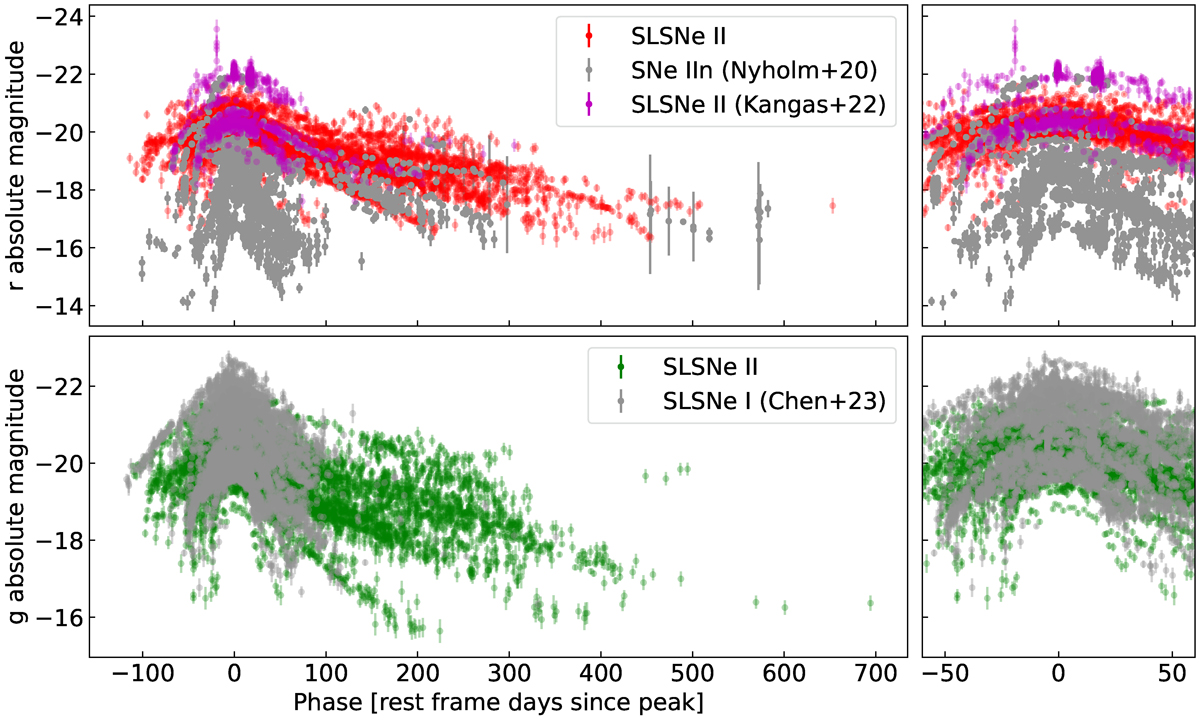
Top left panel: comparison of the rest frame r band light curves of our sample of SLSNe II (red dots), the sample of SLSNe II (magenta dots) of Kangas et al. (2022) and the sample of SNe IIn (gray dots) of Nyholm et al. (2020). Bottom left panel: comparison of the rest frame g band light curves of our samples of SLSNe II (green dots) and the SLSNe I (gray dots) sample of Chen et al. (2023). Top and bottom right panels show the same as the respective left panels but constrained to ± 60 rest frame days from peak.
Current usage metrics show cumulative count of Article Views (full-text article views including HTML views, PDF and ePub downloads, according to the available data) and Abstracts Views on Vision4Press platform.
Data correspond to usage on the plateform after 2015. The current usage metrics is available 48-96 hours after online publication and is updated daily on week days.
Initial download of the metrics may take a while.