Fig. 2.
Download original image
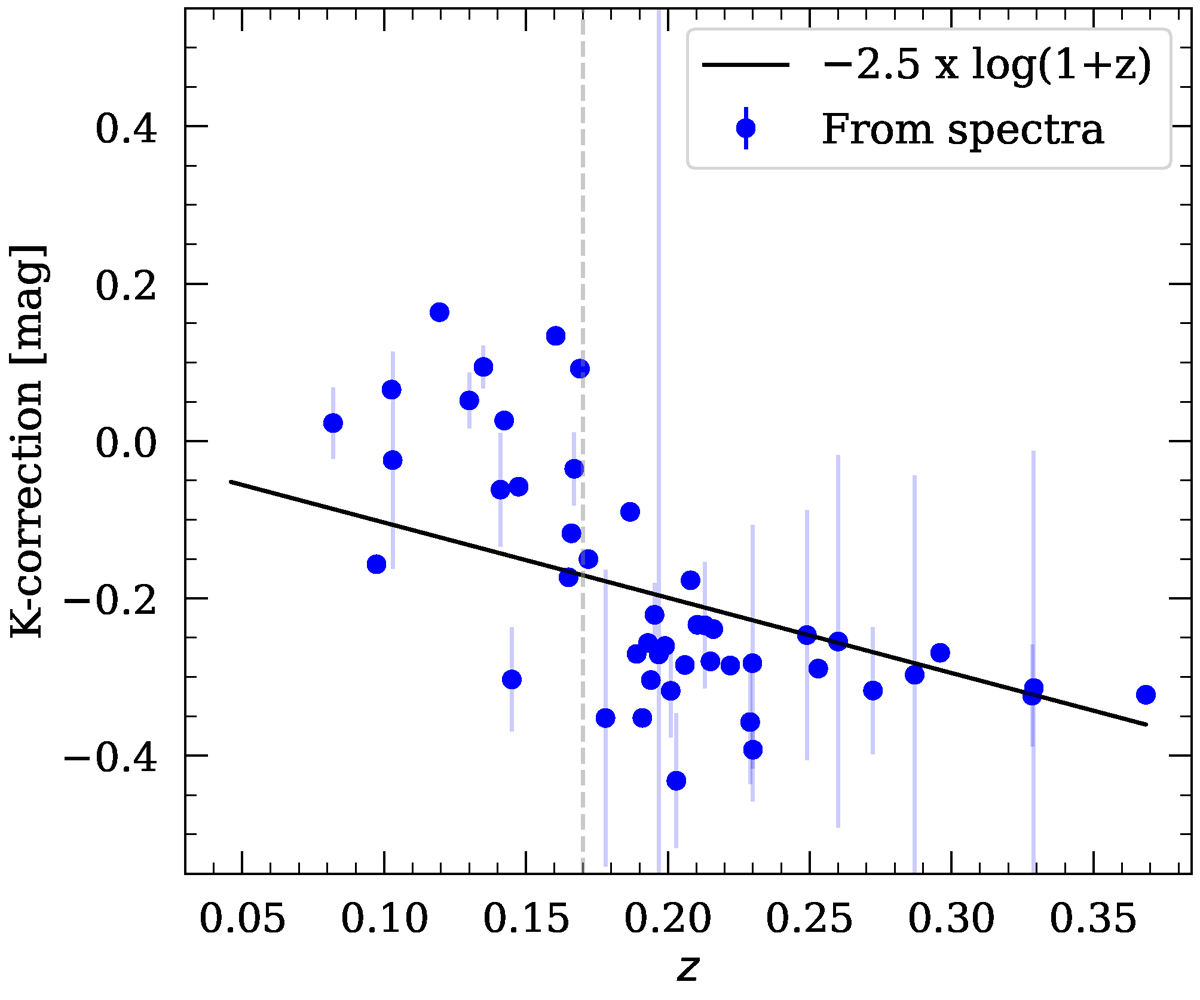
K-correction approximation obtained as −2.5 × log(1 + z) (black line), compared to full K-corrections obtained using SNooPy (blue dots). The inverse of the S/N of the spectrum considered to calculate full K-corrections is presented as associated error bars. The vertical dashed gray line indicates z = 0.17, at which we switch from g to r band to calculate the correction.
Current usage metrics show cumulative count of Article Views (full-text article views including HTML views, PDF and ePub downloads, according to the available data) and Abstracts Views on Vision4Press platform.
Data correspond to usage on the plateform after 2015. The current usage metrics is available 48-96 hours after online publication and is updated daily on week days.
Initial download of the metrics may take a while.