Open Access
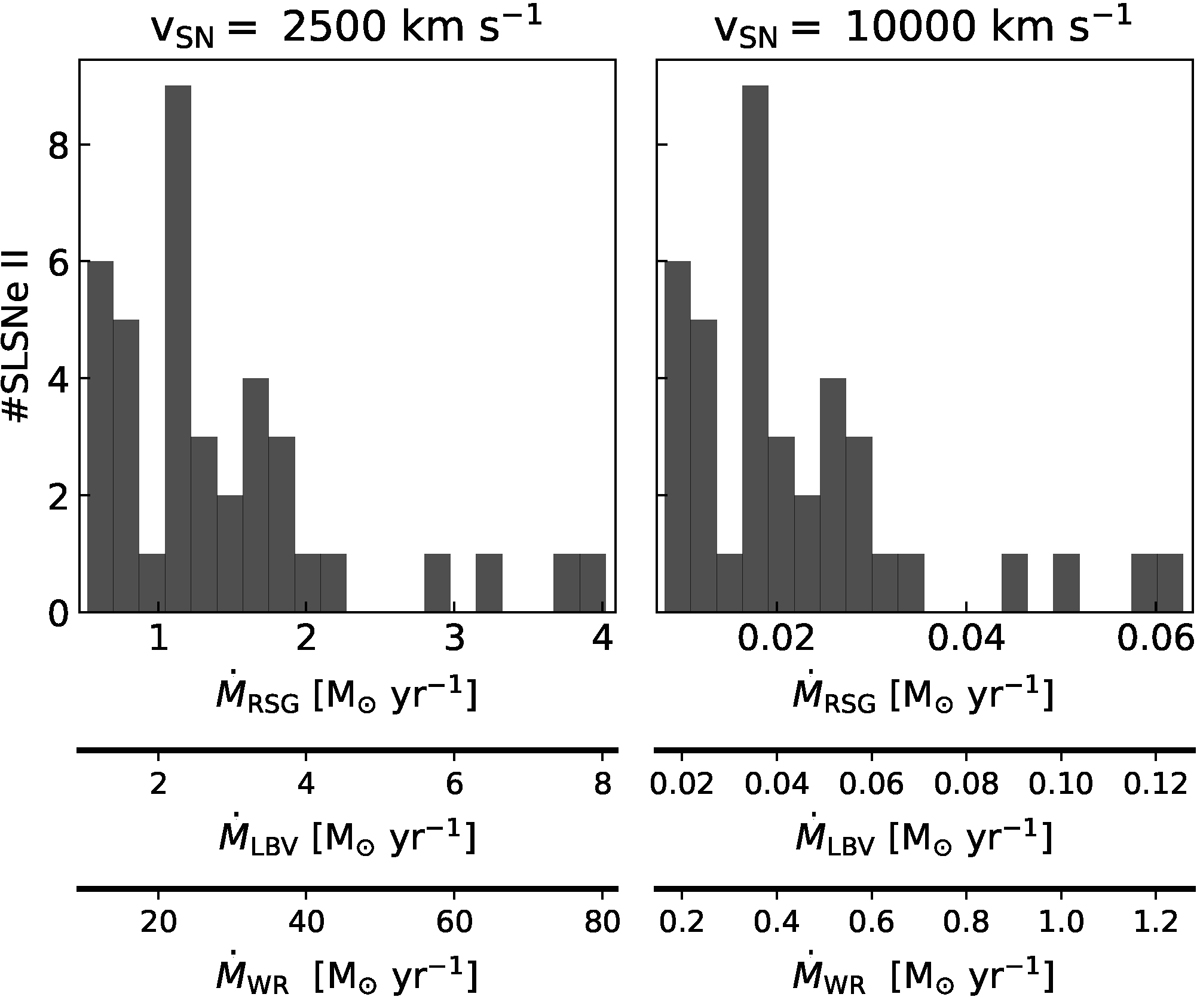
Fig. 15.
Download original image
Mass loss rate (Ṁ) of the SLSNe II for which we can approximate a pseudo-bolometric light curve (see Sect. 3.4) considering a RSG, LBV and WR progenitor. The different mass loss rate ranges are shown in consecutive horizontal axis. The left panel considers vSN = 2500 km s−1 and the right panel vSN = 10 000 km s−1.
Current usage metrics show cumulative count of Article Views (full-text article views including HTML views, PDF and ePub downloads, according to the available data) and Abstracts Views on Vision4Press platform.
Data correspond to usage on the plateform after 2015. The current usage metrics is available 48-96 hours after online publication and is updated daily on week days.
Initial download of the metrics may take a while.