Fig. 14.
Download original image
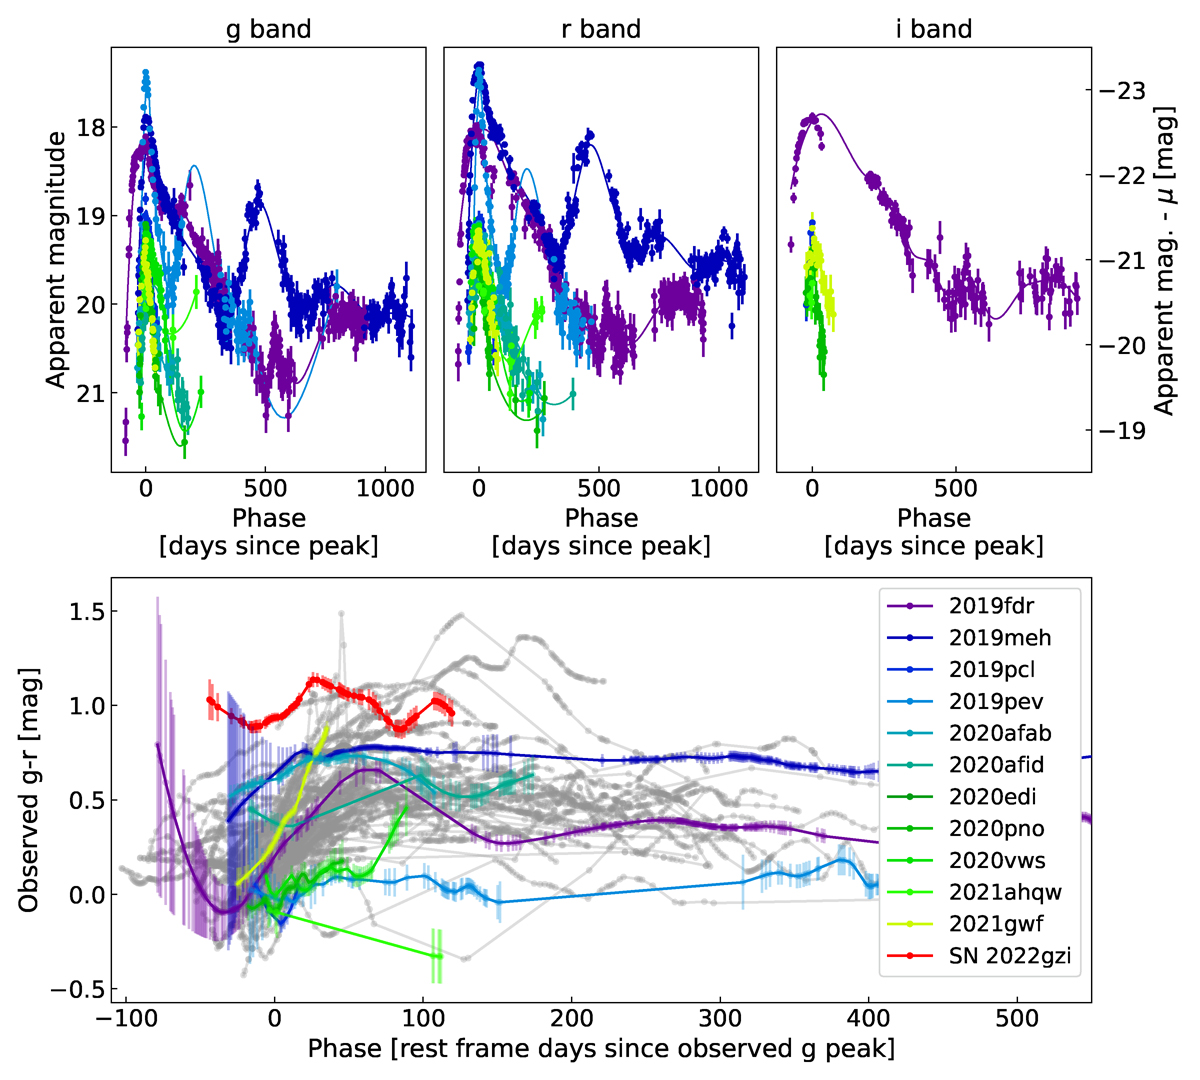
Light curves and g − r colors of events with ambiguous classification. Top panels: gri (left, center, and right panel, respectively) band light curves. The left vertical axis displays the apparent magnitude while the right vertical axis corrects for μ. Bottom panel: Observed g − r colors at around g band peak versus rest frame g band peak absolute magnitude of the ambiguous transients (green to blue colors) and our SLSN II (gray). In red we highlight SN 2022gzi as the reddest event in the sample.
Current usage metrics show cumulative count of Article Views (full-text article views including HTML views, PDF and ePub downloads, according to the available data) and Abstracts Views on Vision4Press platform.
Data correspond to usage on the plateform after 2015. The current usage metrics is available 48-96 hours after online publication and is updated daily on week days.
Initial download of the metrics may take a while.