Fig. 13.
Download original image
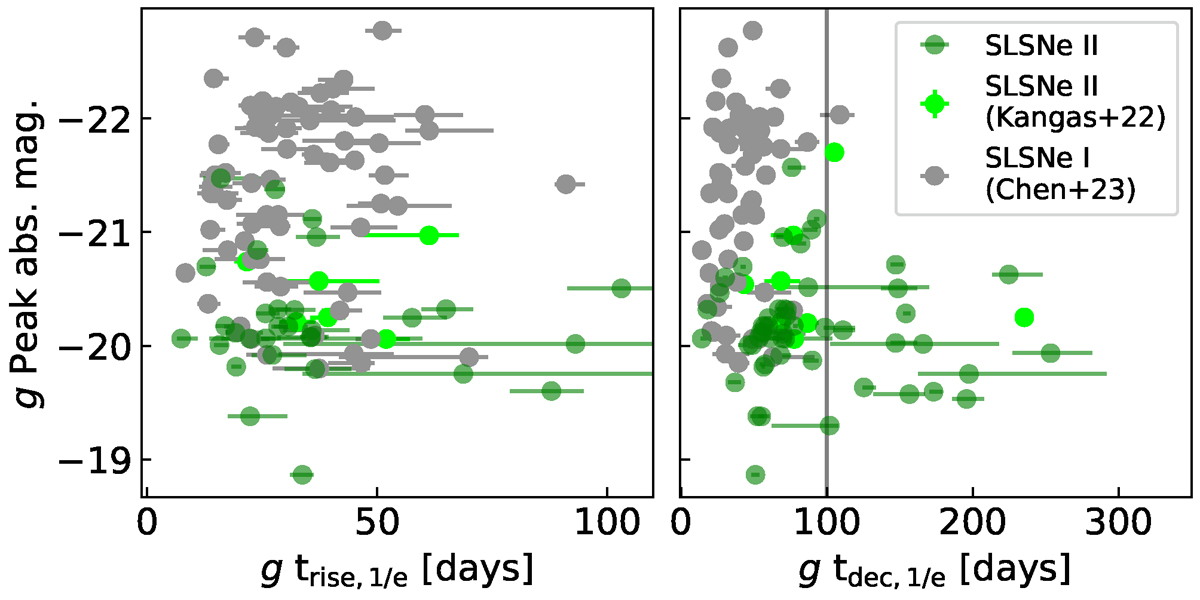
Comparison of g band timescales versus peak absolute magnitudes for SLSN II and SLSN I. Left panel: g band trise, 1/e versus rest frame peak absolute magnitude for our sample of SLSNe II (green circles) and for the SLSN I (gray circles) sample of Chen et al. (2023). Right panel: g band tdec, 1/e versus rest frame peak absolute magnitude for our sample of SLSNe II (green circles) and the SLSN I (gray circles) sample of Chen et al. (2023).
Current usage metrics show cumulative count of Article Views (full-text article views including HTML views, PDF and ePub downloads, according to the available data) and Abstracts Views on Vision4Press platform.
Data correspond to usage on the plateform after 2015. The current usage metrics is available 48-96 hours after online publication and is updated daily on week days.
Initial download of the metrics may take a while.