Open Access
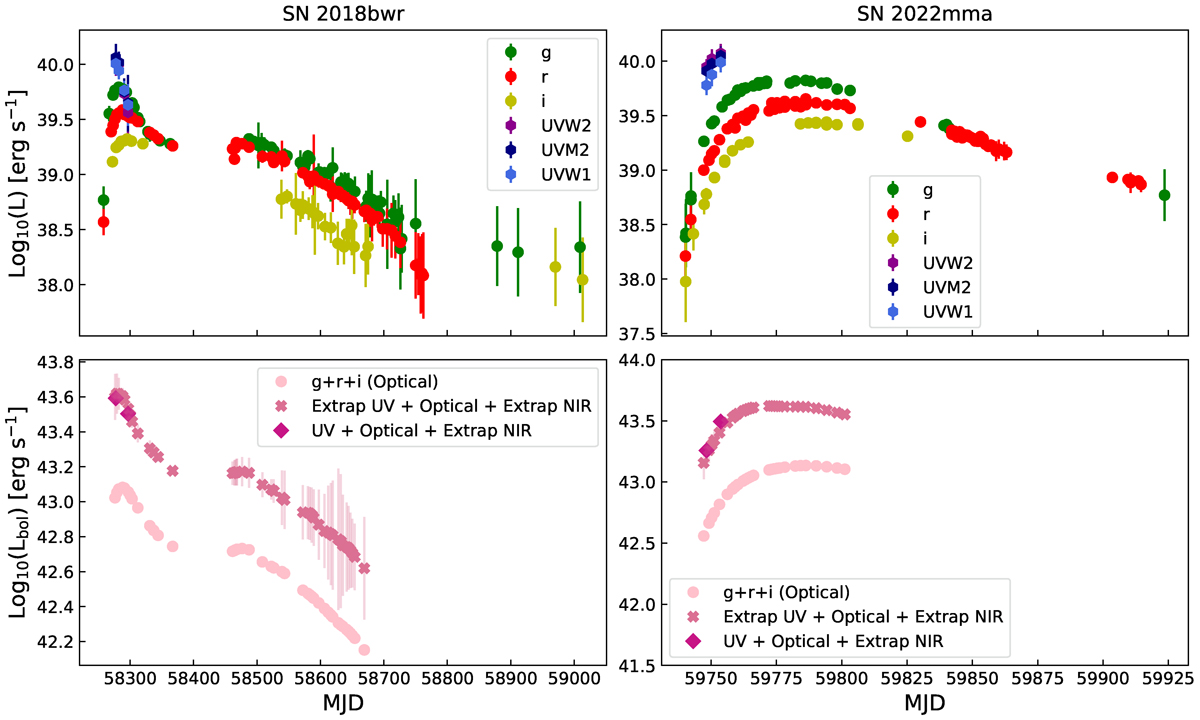
Fig. 10.
Download original image
Pseudo-bolometric light curves including UVOT observations. The top panels show the observed gri+UVOT light curves and the bottom panels the calculated pseudo-bolometric light curves for SN 2018bwr (left) and SN 2022mma (right).
Current usage metrics show cumulative count of Article Views (full-text article views including HTML views, PDF and ePub downloads, according to the available data) and Abstracts Views on Vision4Press platform.
Data correspond to usage on the plateform after 2015. The current usage metrics is available 48-96 hours after online publication and is updated daily on week days.
Initial download of the metrics may take a while.