Open Access
Fig. 1.
Download original image
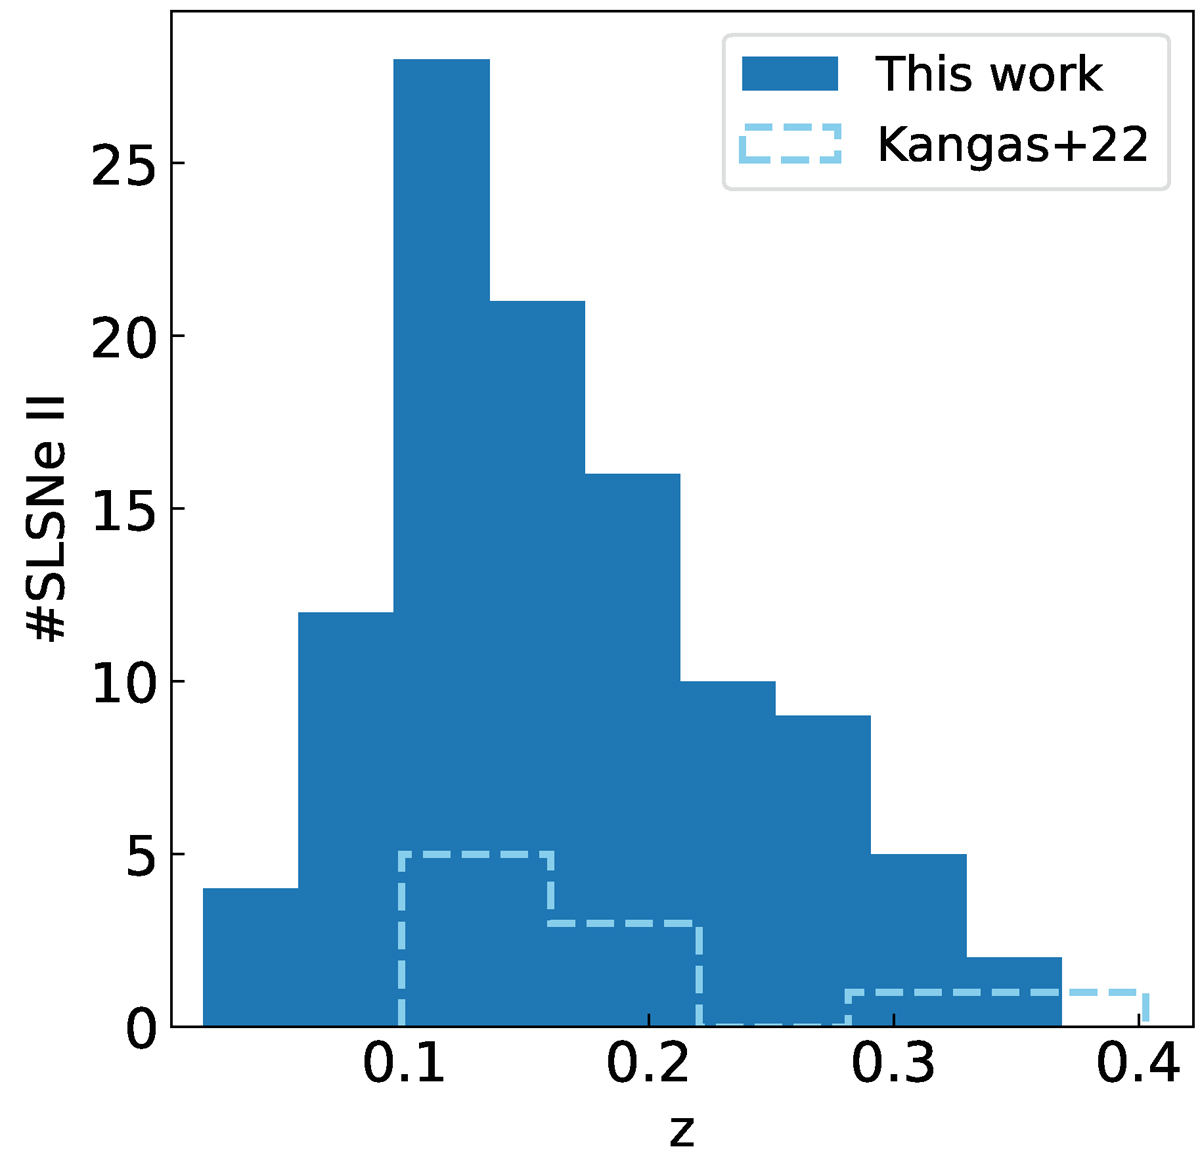
Redshift distribution of the 107 events in our ZTF SLSN II sample in blue, filled regions. In dashed, empty, sky-blue regions we show the redshift distribution of the ten events in the ZTF SLSN II sample presented by Kangas et al. (2022), see Sect. 5.1 for a discussion.
Current usage metrics show cumulative count of Article Views (full-text article views including HTML views, PDF and ePub downloads, according to the available data) and Abstracts Views on Vision4Press platform.
Data correspond to usage on the plateform after 2015. The current usage metrics is available 48-96 hours after online publication and is updated daily on week days.
Initial download of the metrics may take a while.