Fig. 4

Download original image
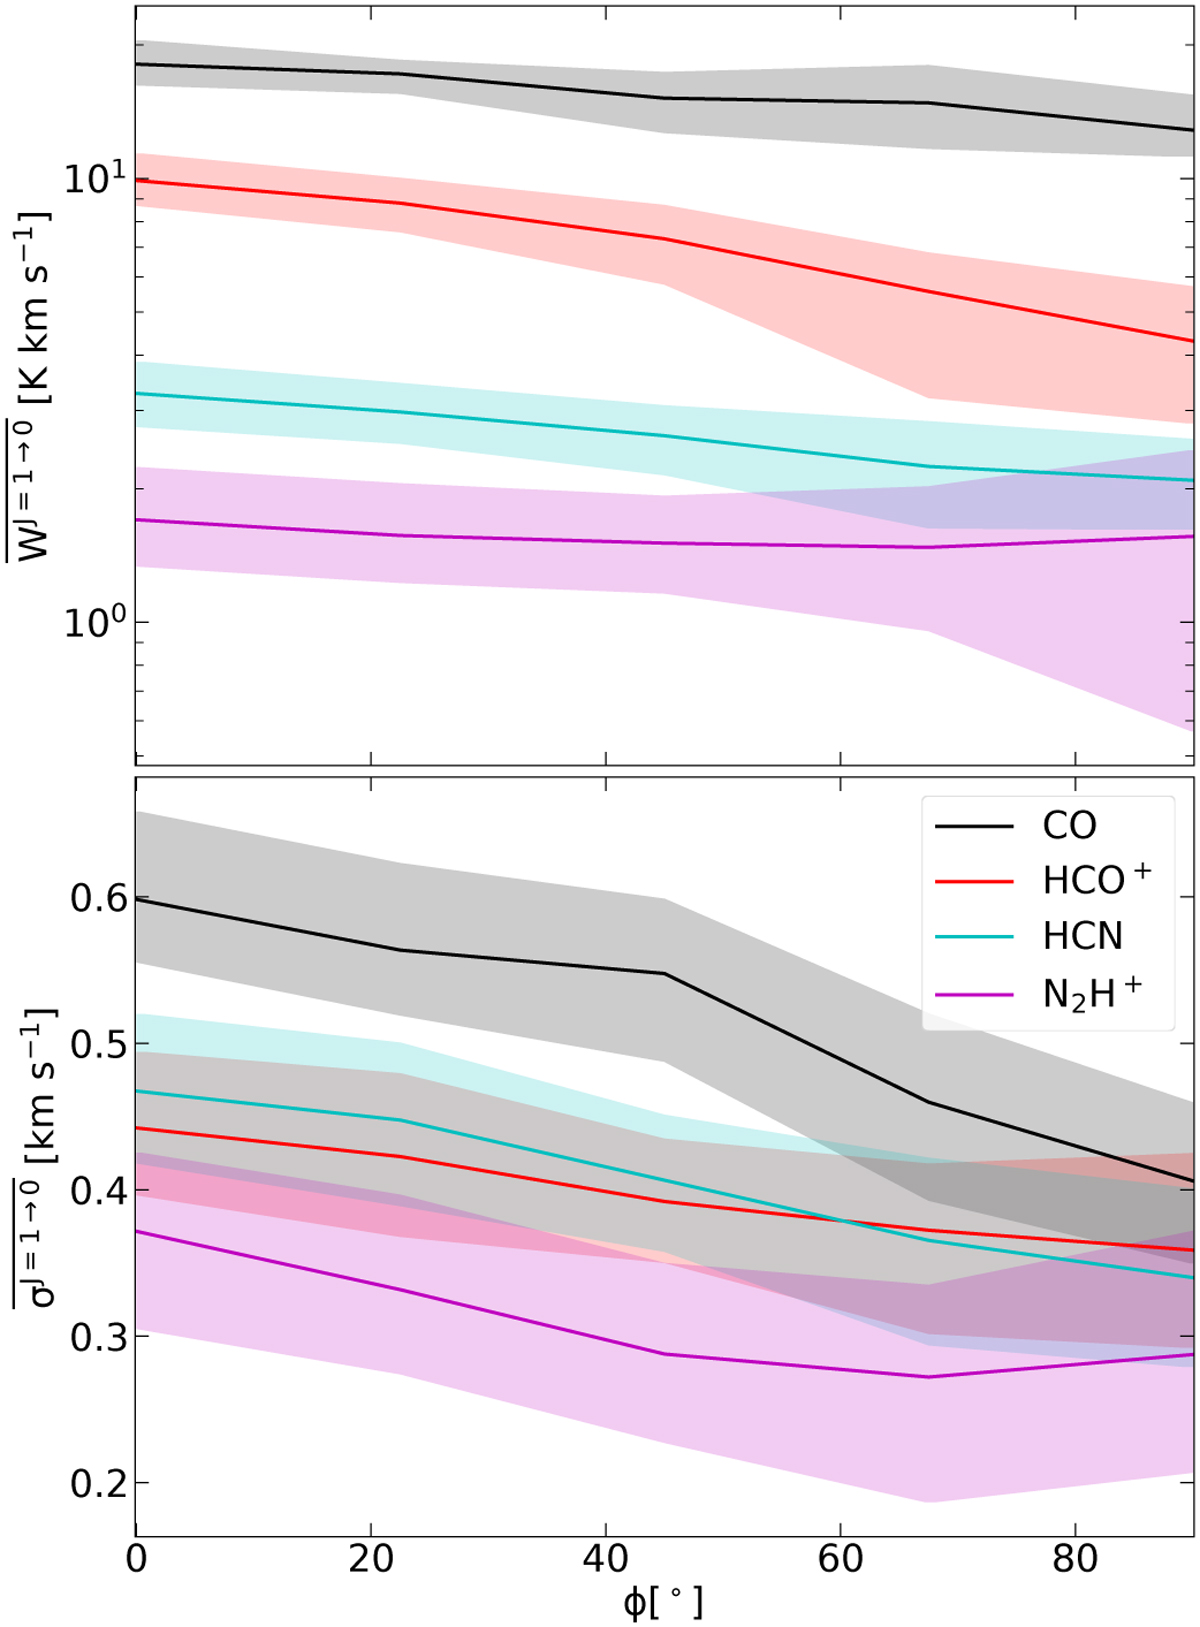
Dependence of the average of the zeroth and second moment maps (upper and lower panels, respectively) on the projection angle for each of the species for which we have produced synthetic observations. Averages are computed within the red ellipses shown in the rightcolumn of Fig. 3. Shaded regions show the 16th and 84th percentiles of the distributions of values within the ellipses shown in the right column of Fig. 3. For all species, we observe a decrease in the derived velocity dispersion with increasing polar angle. The same trend is true for the velocity-integrated emission, apart from N2H+, for which the average of the zeroth-moment maps remains roughly constant.
Current usage metrics show cumulative count of Article Views (full-text article views including HTML views, PDF and ePub downloads, according to the available data) and Abstracts Views on Vision4Press platform.
Data correspond to usage on the plateform after 2015. The current usage metrics is available 48-96 hours after online publication and is updated daily on week days.
Initial download of the metrics may take a while.


