Fig. 3
Download original image
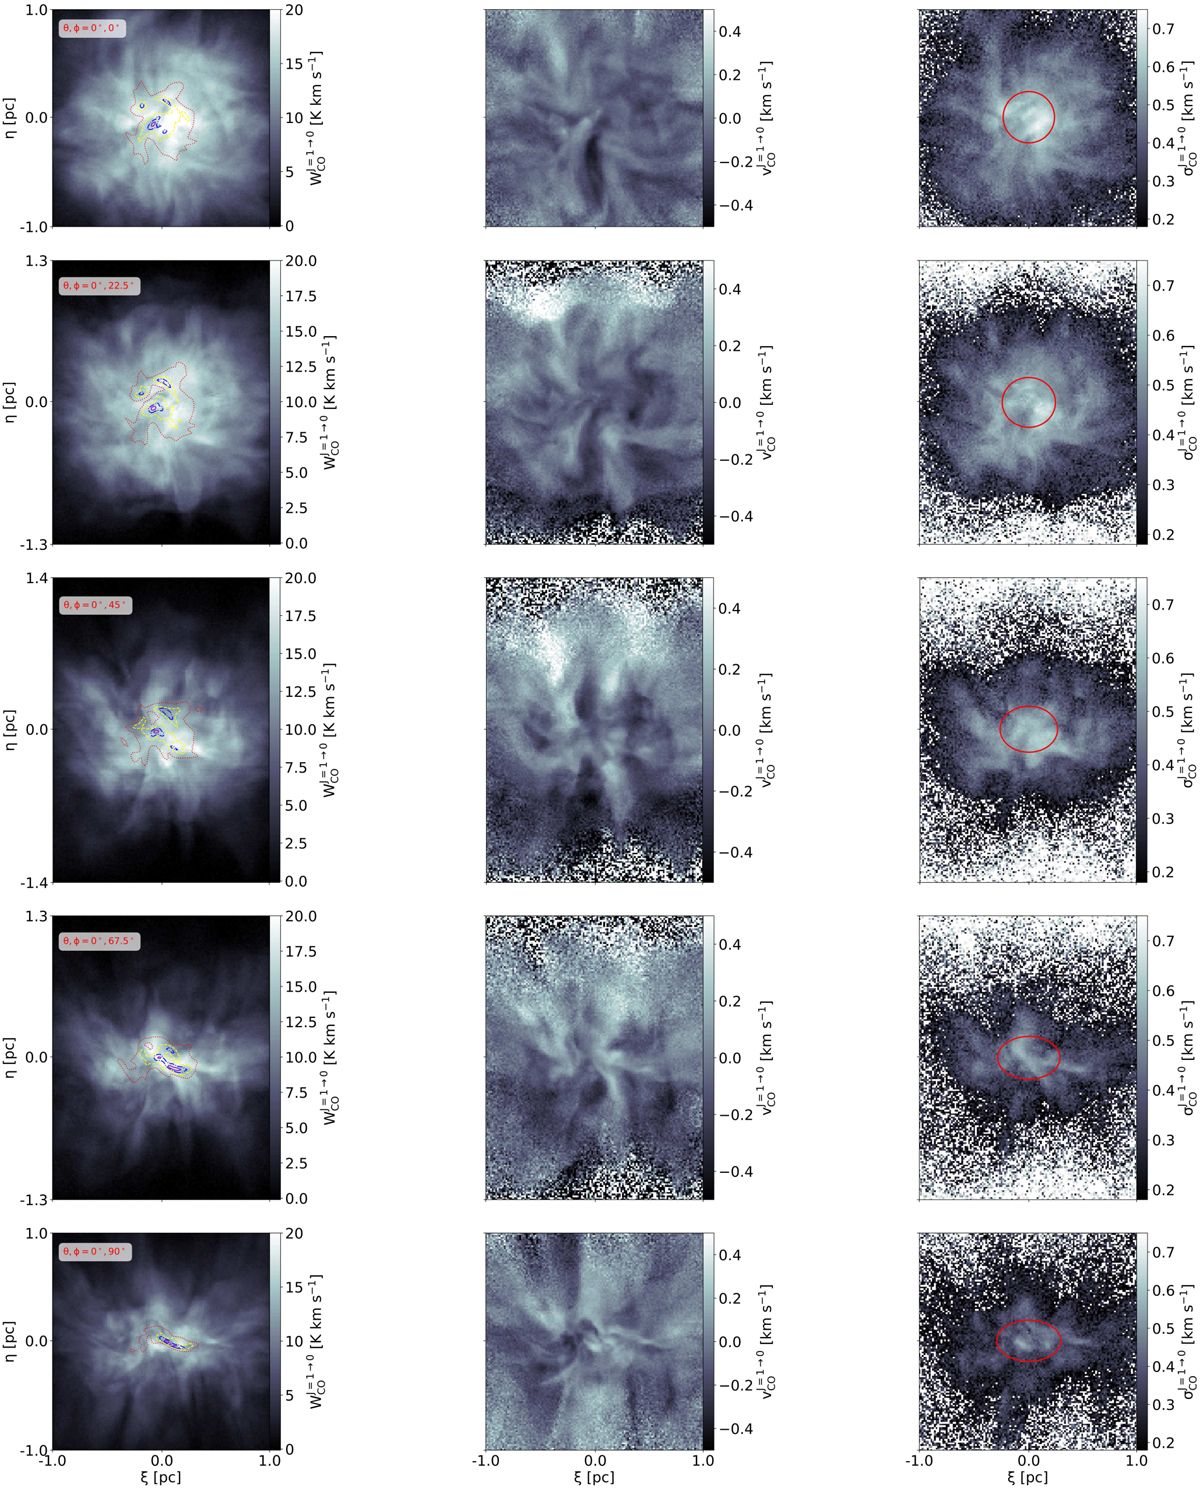
Moment maps from the CO (J = 1 → 0) transition from our chemo-dynamical simulation under different projection angles. In the left, middle and left columns we show the zeroth, first and second moment maps, respectively. In the upper row the mean component of the magnetic field is along the LOS, whereas in the bottom row the mean magnetic field lies in the plane of the sky. Intermediate angles are shown in the second, third and fourth rows (the azimuthal and polar angles are indicated in the upper left corners of the zeroth moment maps). The red dotted, yellow dash, blue dash-dotted, and solid violet contours represent 30, 50, 70, and 90% of the maximum column density, respectively. The red ellipses in the right column show the region used to extract average values as a function of the projection angle (see text and Fig. 4).
Current usage metrics show cumulative count of Article Views (full-text article views including HTML views, PDF and ePub downloads, according to the available data) and Abstracts Views on Vision4Press platform.
Data correspond to usage on the plateform after 2015. The current usage metrics is available 48-96 hours after online publication and is updated daily on week days.
Initial download of the metrics may take a while.