Fig. 2
Download original image
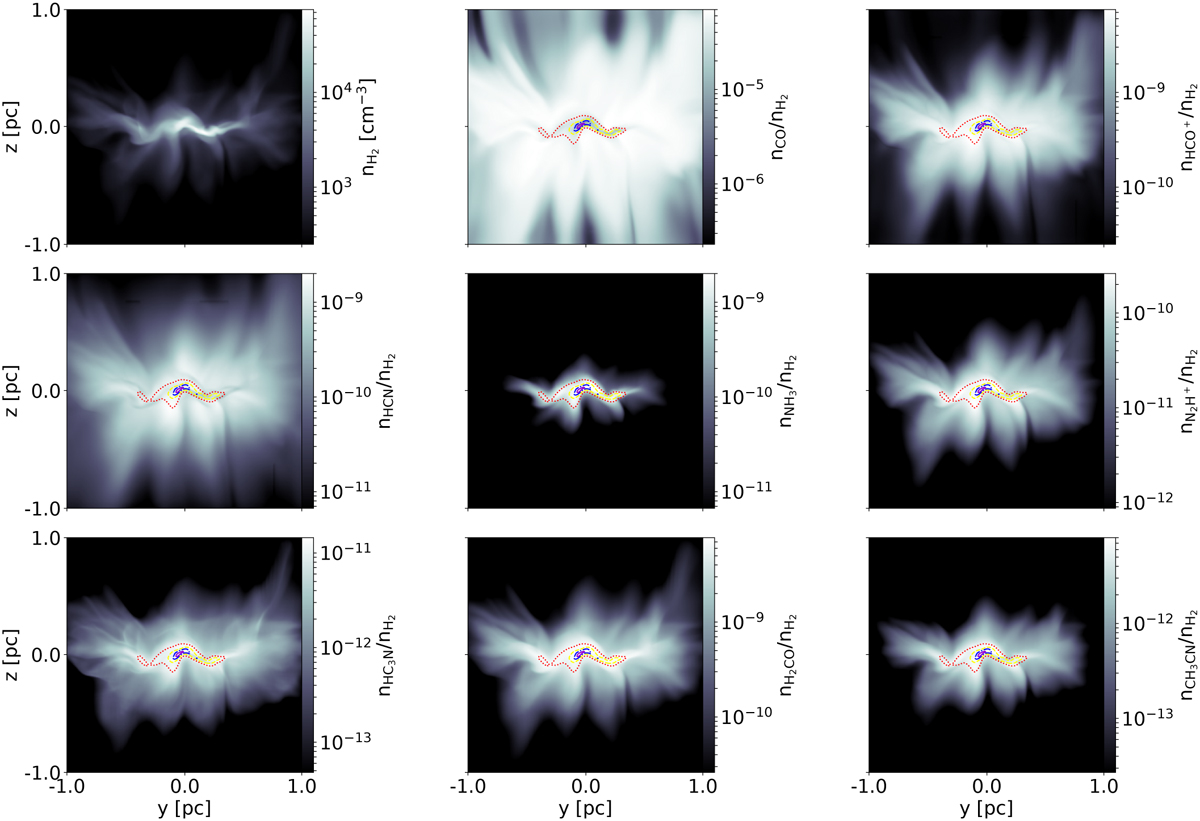
Averaged slices (within 0.05 pc) along the x axis, centered at the location of the maximum number density in the cloud, showing the spatial distribution of various molecules. In the upper left panel, we show the H2 number density, and in the rest of the panels we show the abundances of various, commonly observed species. The dotted red, dash yellow, dash-dotted blue, and solid violet contours represent 30, 50, 70, and 90% of the maximum 3D visual extinction within the cloud, respectively.
Current usage metrics show cumulative count of Article Views (full-text article views including HTML views, PDF and ePub downloads, according to the available data) and Abstracts Views on Vision4Press platform.
Data correspond to usage on the plateform after 2015. The current usage metrics is available 48-96 hours after online publication and is updated daily on week days.
Initial download of the metrics may take a while.