Fig. 3.
Download original image
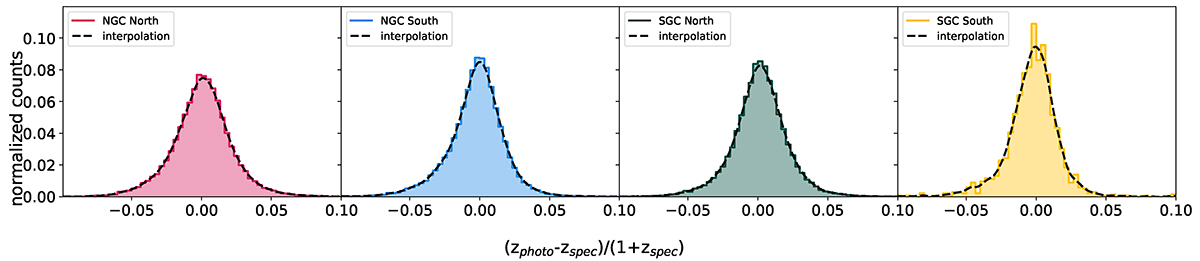
Uncertainties of the photometric redshifts for the 0.6–0.8 redshift range. First (leftmost) panel: Distribution for BASS/MzLS. Dotted black lines show the smoothed interpolation function used for the photometric redshift painting. Second panel: Same but for DECaLS within the NGC. Third panel: Same but for DECaLS within the northern part of the SGC. Forth panel: Same but for DECaLS within the southern part of the SGC.
Current usage metrics show cumulative count of Article Views (full-text article views including HTML views, PDF and ePub downloads, according to the available data) and Abstracts Views on Vision4Press platform.
Data correspond to usage on the plateform after 2015. The current usage metrics is available 48-96 hours after online publication and is updated daily on week days.
Initial download of the metrics may take a while.