Fig. 9
Download original image
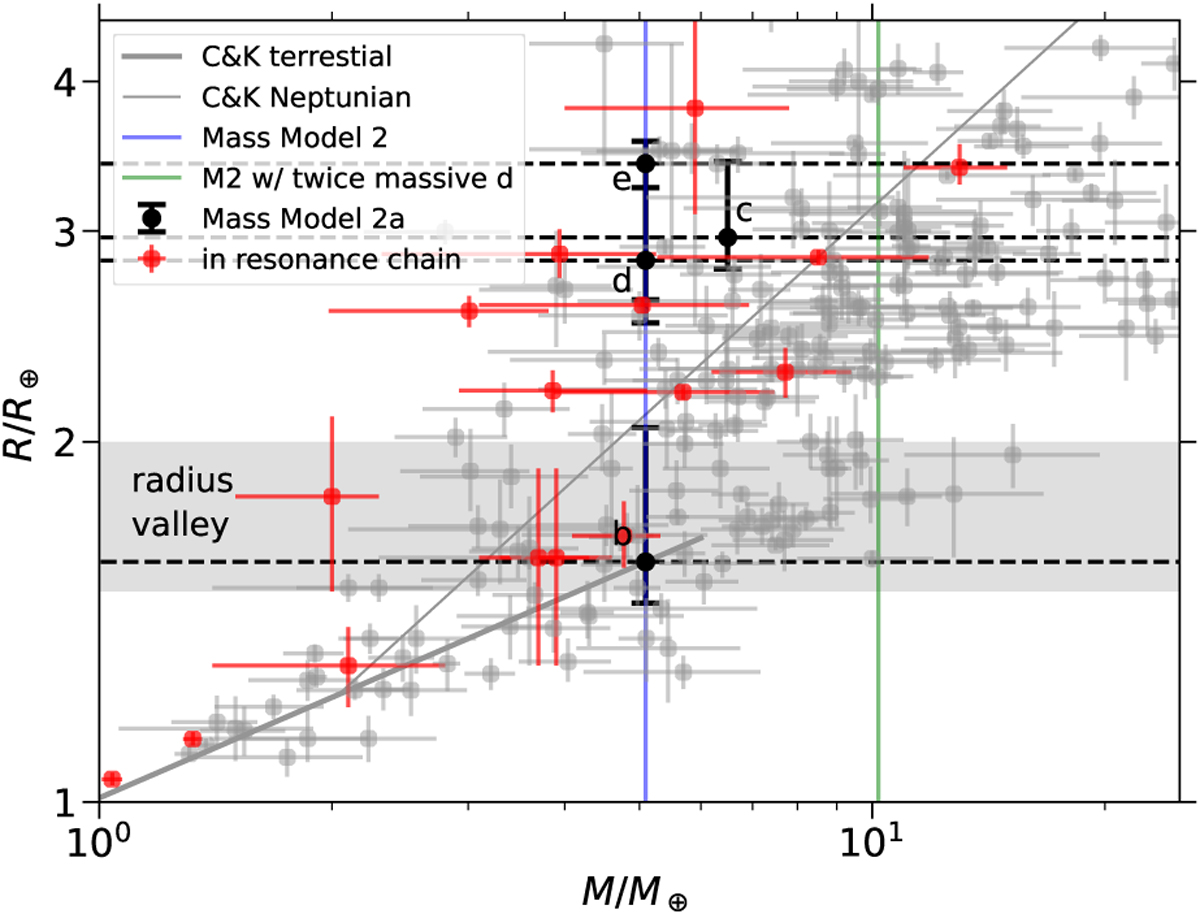
Mass-radius diagram of the Kepler-221 planets with mass models listed in Table 2 along with the exoplanets sample. Black dots and error bars represent the masses of planets according to mass model M2a of Table 2 and radii according to Table 1. The blue line shows the masses of the planets according to mass model M2 of Table 2. The gray lines provide the mass-radius relation according to Chen & Kipping (2017). The green line indicates the mass of d if it would be twice as massive as the other planets, following mass model M2d of Table 2. The background dots and error bars show the masses and radii of other exoplanets, with those in red representing planets in a first-order resonance chain involving at least three planets. The gray area shows the radius valley between 1.5R⊕ and 2.0R⊕ according to Fulton et al. (2017).
Current usage metrics show cumulative count of Article Views (full-text article views including HTML views, PDF and ePub downloads, according to the available data) and Abstracts Views on Vision4Press platform.
Data correspond to usage on the plateform after 2015. The current usage metrics is available 48-96 hours after online publication and is updated daily on week days.
Initial download of the metrics may take a while.