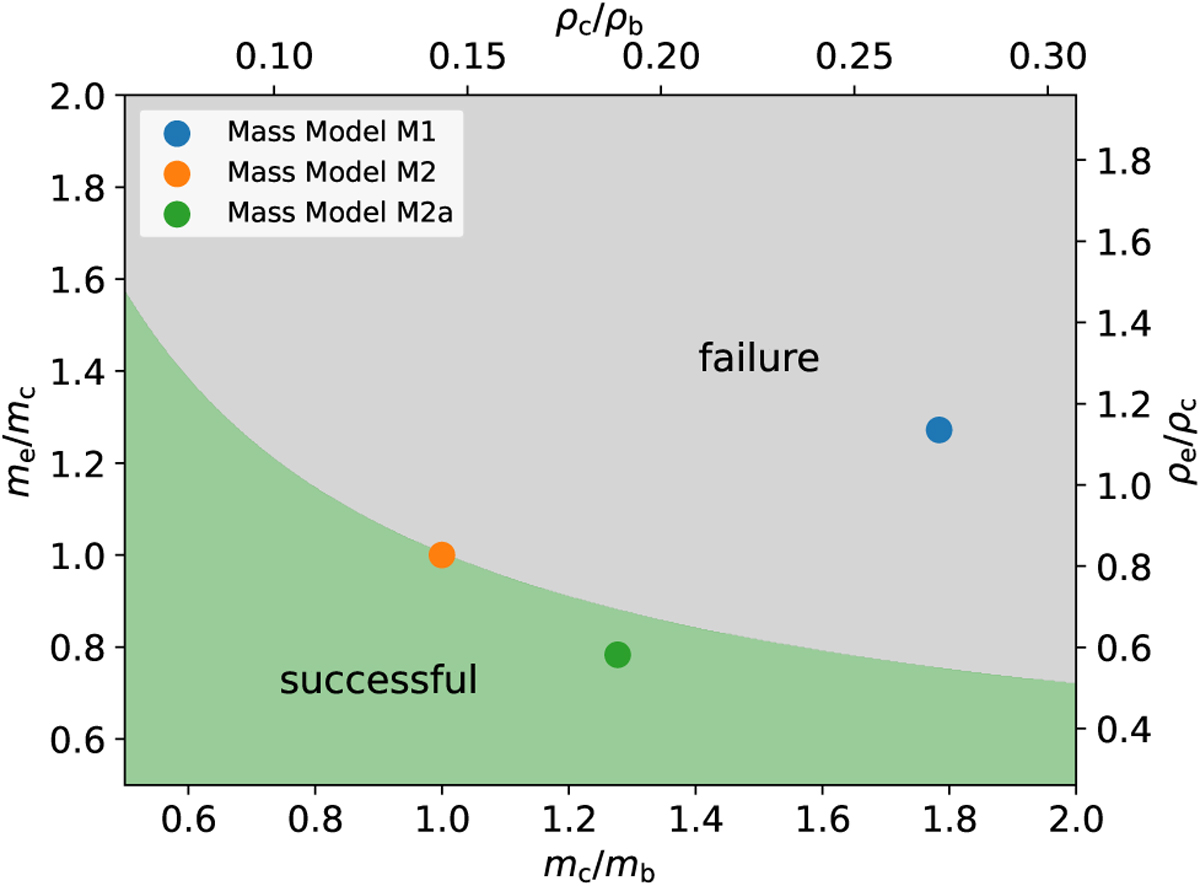
Fig. 8
Download original image
Constraints on planet mass and density ratios in the orbital expansion phase with the radius of the planets according to Table 1. The green region corresponds to the area satisfying acde > 1.56, where orbital expansion to the observed period ratio is possible, while the planets cannot reach the observed period ratio if the planet mass ratio falls in the gray region. The colored dots represent different mass models in Table 2. The conversion to density ratios (upper and right axes) has assumed the radii of the planets according to Table 1.
Current usage metrics show cumulative count of Article Views (full-text article views including HTML views, PDF and ePub downloads, according to the available data) and Abstracts Views on Vision4Press platform.
Data correspond to usage on the plateform after 2015. The current usage metrics is available 48-96 hours after online publication and is updated daily on week days.
Initial download of the metrics may take a while.