Fig. 5
Download original image
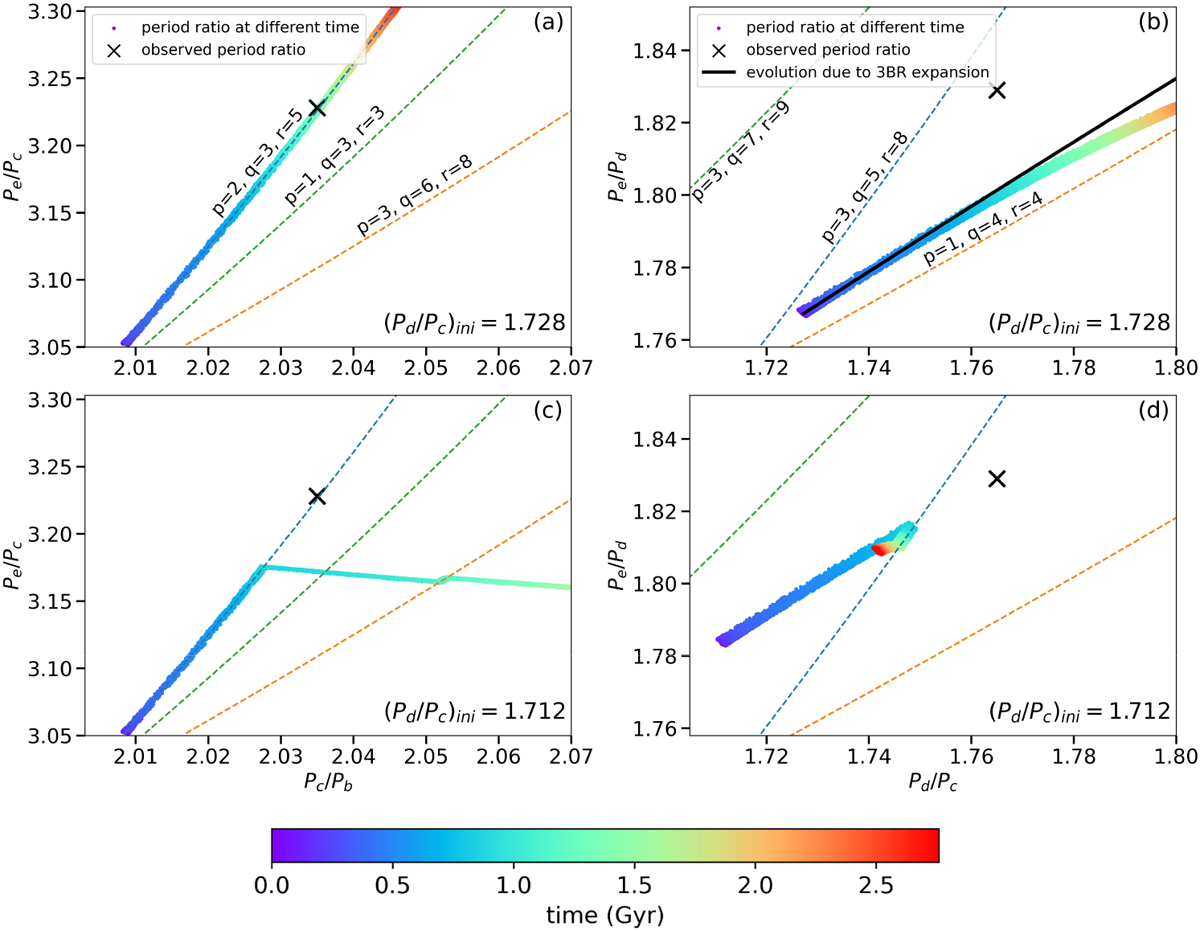
Effect of the initial location of planet d on the expansion process of the Kepler-221 system. Two simulations with identical masses of the planet following mass model M1 (Table 2) and different initial positions are shown from top to bottom. The left panels show the evolution of Pc/Pb and Pe/Pc and the right panels show the evolution of Pd/Pc and Pe/Pd. In the panels, colored dots represent the evolution of the period ratios with the color bar indicating time. The black crosses represent the current period ratio of the system. Dashed lines of different colors correspond to different 3BRs between b, c, and e or c, d, and e, with p, q, and r defined in Equation (2). The black line in panel b represents the analytical evolution of the period ratio only considering b, c, and e 3BR expansion with the position of d fixed.
Current usage metrics show cumulative count of Article Views (full-text article views including HTML views, PDF and ePub downloads, according to the available data) and Abstracts Views on Vision4Press platform.
Data correspond to usage on the plateform after 2015. The current usage metrics is available 48-96 hours after online publication and is updated daily on week days.
Initial download of the metrics may take a while.