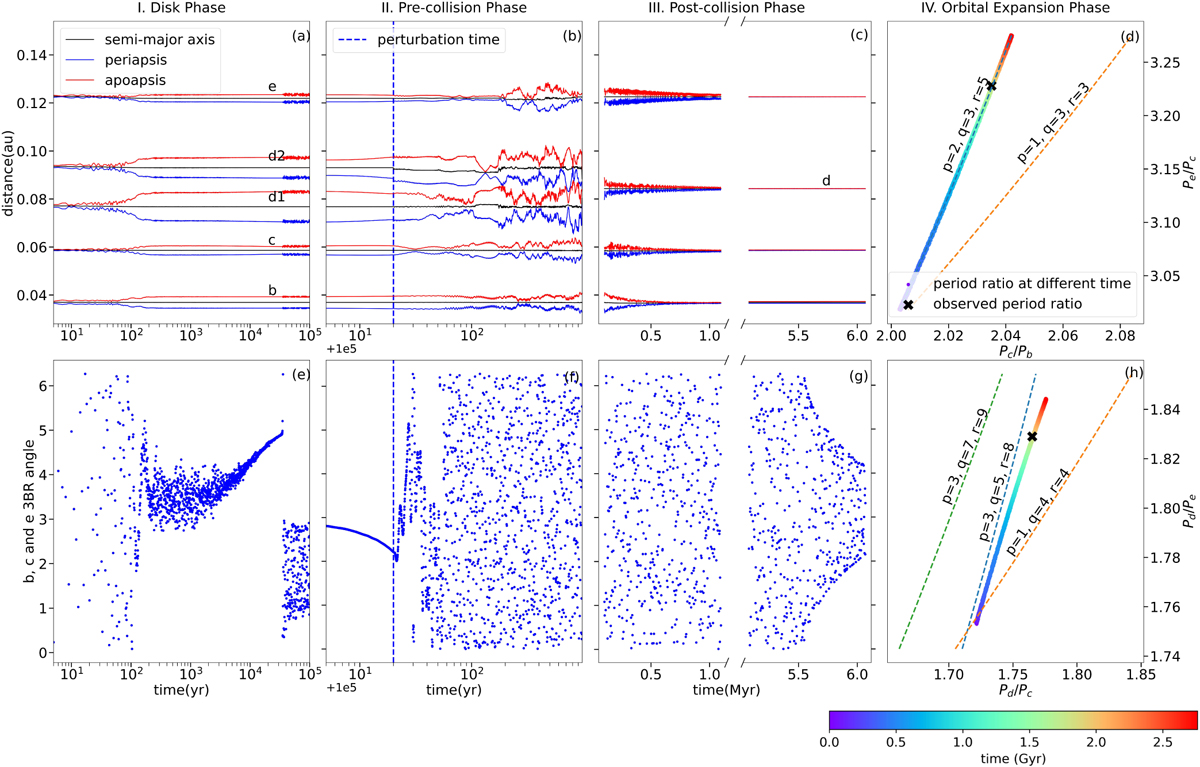
Fig. 2
Download original image
Successful simulation spanning all simulation phases depicted in Figure 1. Panels a, b, and c show the semi-major axis and eccentricity evolution of the first three phases, and panels d, e, and f show the corresponding 3BR angle between planets b, c, and e. The evolution in the orbital expansion phase is represented by the period ratio evolution of planets c, d, and e in panels d and h.
Current usage metrics show cumulative count of Article Views (full-text article views including HTML views, PDF and ePub downloads, according to the available data) and Abstracts Views on Vision4Press platform.
Data correspond to usage on the plateform after 2015. The current usage metrics is available 48-96 hours after online publication and is updated daily on week days.
Initial download of the metrics may take a while.