Fig. D.1
Download original image
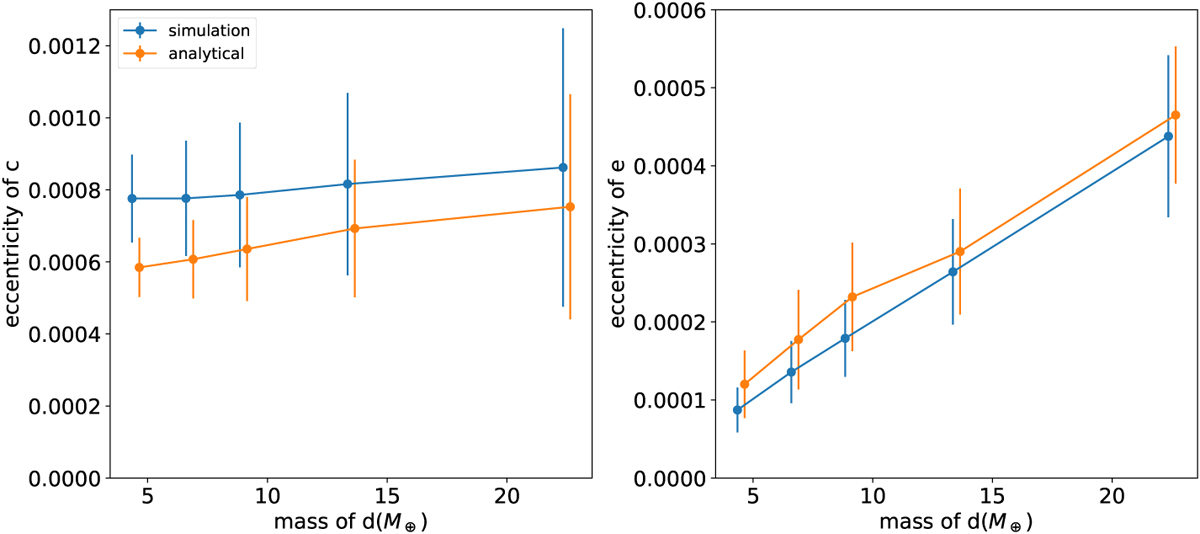
Comparison between the eccentricity of planets in the N-body simulation (blue line) and the analytical value due to secular interaction, calculated according to Murray & Dermott (1999). The left panel corresponds to the eccentricity of planet c and the right panel corresponds to planet e. The blue line shows the average and standard deviation of planet eccentricities in the simulation with different masses of d and the yellow line shows the mean and standard deviation of the Laplace-Lagrante theory averaged over random initial conditions sampled at different time.
Current usage metrics show cumulative count of Article Views (full-text article views including HTML views, PDF and ePub downloads, according to the available data) and Abstracts Views on Vision4Press platform.
Data correspond to usage on the plateform after 2015. The current usage metrics is available 48-96 hours after online publication and is updated daily on week days.
Initial download of the metrics may take a while.