Fig. C.1
Download original image
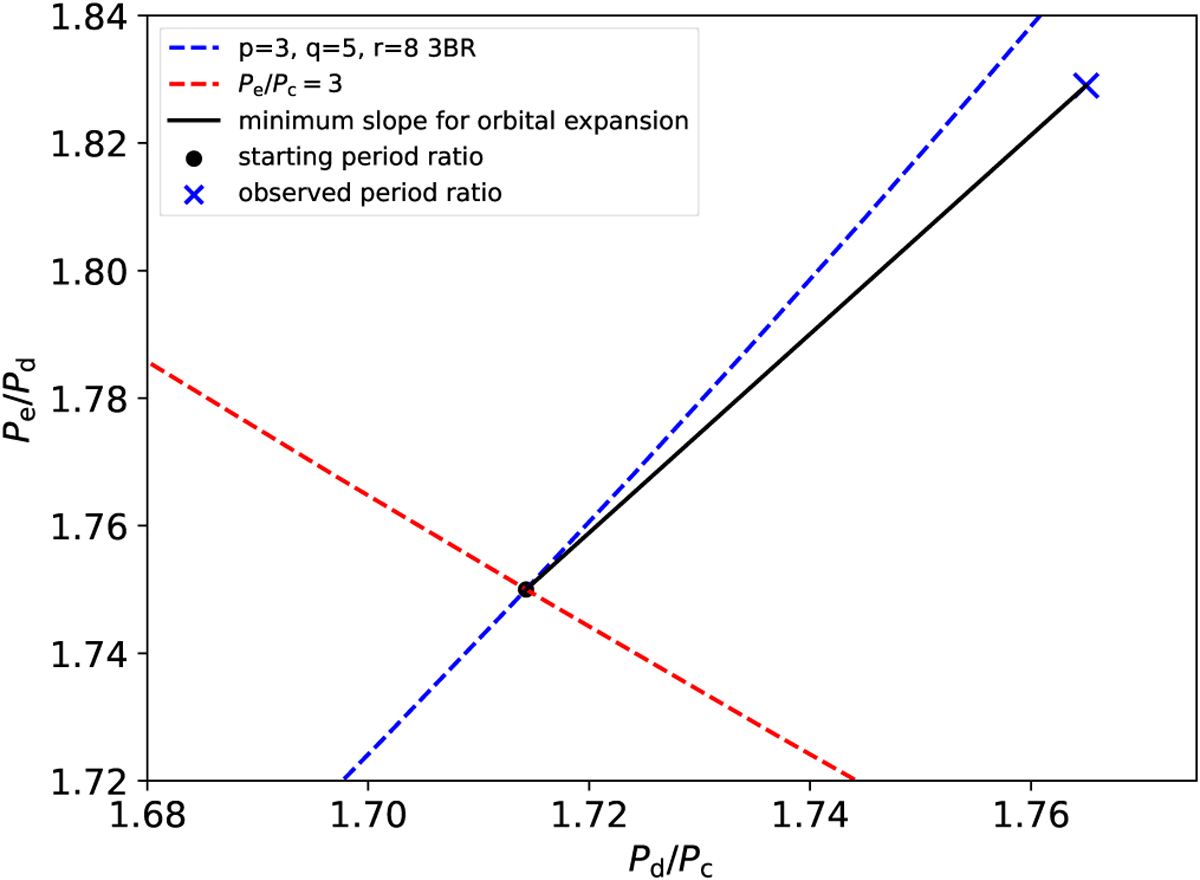
Simplified model of the orbital expansion phase showing the evolution of Pd/Pc and Pe/Pd. The blue dashed line corresponds to the (3, 5, 8) 3BR for planets c, d, and e. The red dashed line represents the period ratio following Pe/Pc > 3. The blue cross is the observed period ratio and the black line represents the minimum slope of Pd/Pc and Pe/Pd which ensures successful orbital expansion to the observed period ratio.
Current usage metrics show cumulative count of Article Views (full-text article views including HTML views, PDF and ePub downloads, according to the available data) and Abstracts Views on Vision4Press platform.
Data correspond to usage on the plateform after 2015. The current usage metrics is available 48-96 hours after online publication and is updated daily on week days.
Initial download of the metrics may take a while.