Open Access
Fig. A.1.
Download original image
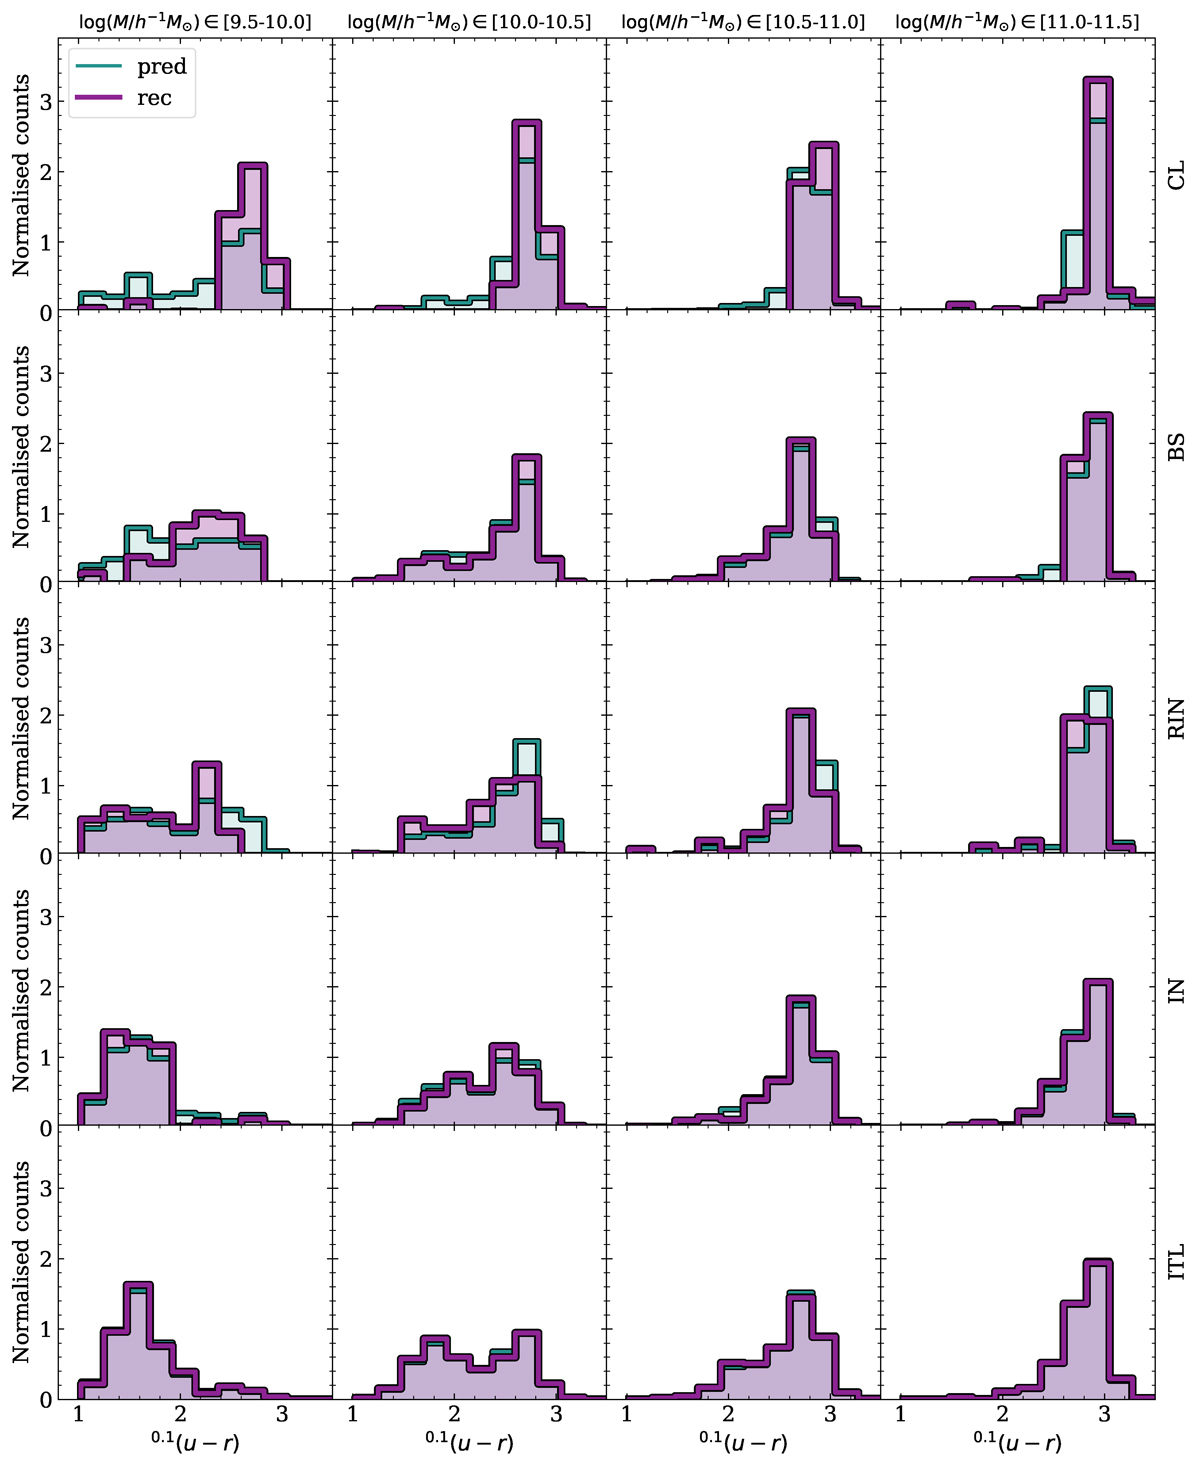
Application of our method to the sample of galaxies in and around X-ray clusters used by Martínez et al. (2023). As in Fig. 2, rows show different classes, and columns different stellar mass ranges. Green shaded histograms are predicted colour distributions and violet shaded histograms recovered colour distributions.
Current usage metrics show cumulative count of Article Views (full-text article views including HTML views, PDF and ePub downloads, according to the available data) and Abstracts Views on Vision4Press platform.
Data correspond to usage on the plateform after 2015. The current usage metrics is available 48-96 hours after online publication and is updated daily on week days.
Initial download of the metrics may take a while.