Fig. 3.
Download original image
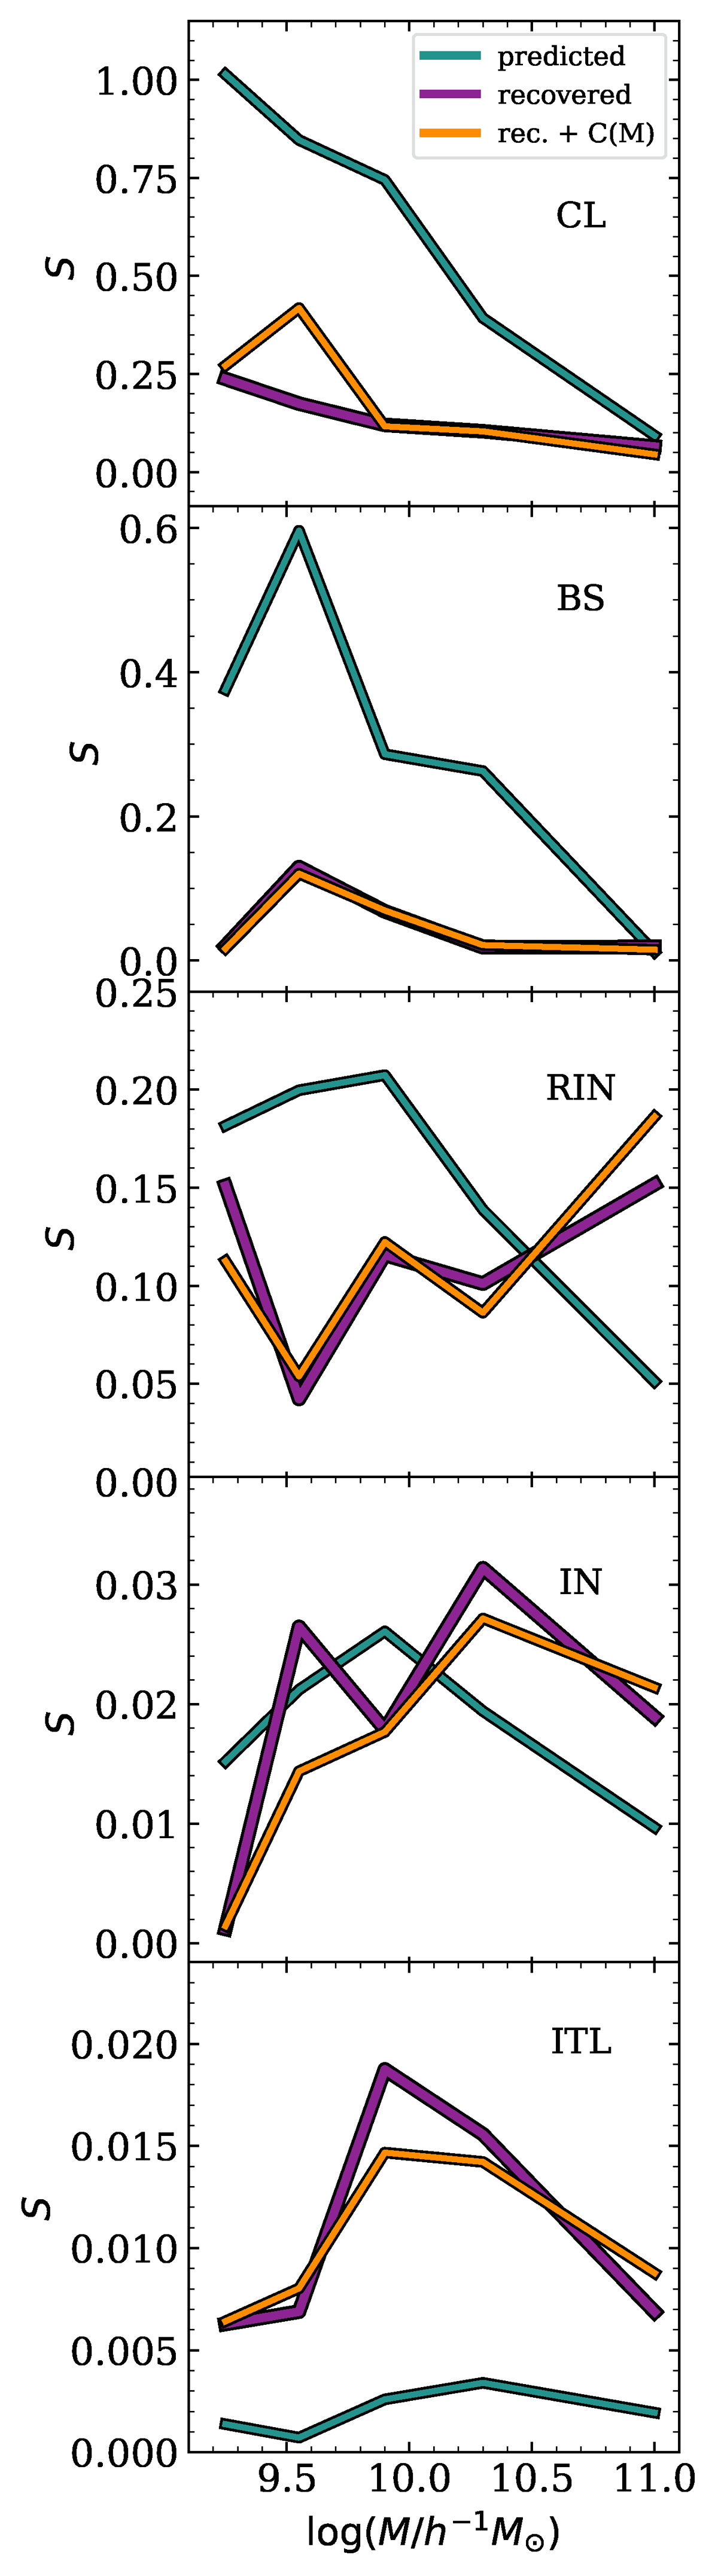
Sum of square residuals as a function of galaxy stellar mass. Each panel considers a different galaxy class. Residuals between the real and the predicted distributions are shown with green lines, i.e. Spred in Eq. (6). Residuals between the real and the recovered distributions are shown with violet lines, i.e. Srec in Eq. (7). The residuals between the real and the recovered distributions when we use a stellar mass-dependent confusion matrix are shown in orange. Note that the y-axis scale varies from panel to panel.
Current usage metrics show cumulative count of Article Views (full-text article views including HTML views, PDF and ePub downloads, according to the available data) and Abstracts Views on Vision4Press platform.
Data correspond to usage on the plateform after 2015. The current usage metrics is available 48-96 hours after online publication and is updated daily on week days.
Initial download of the metrics may take a while.