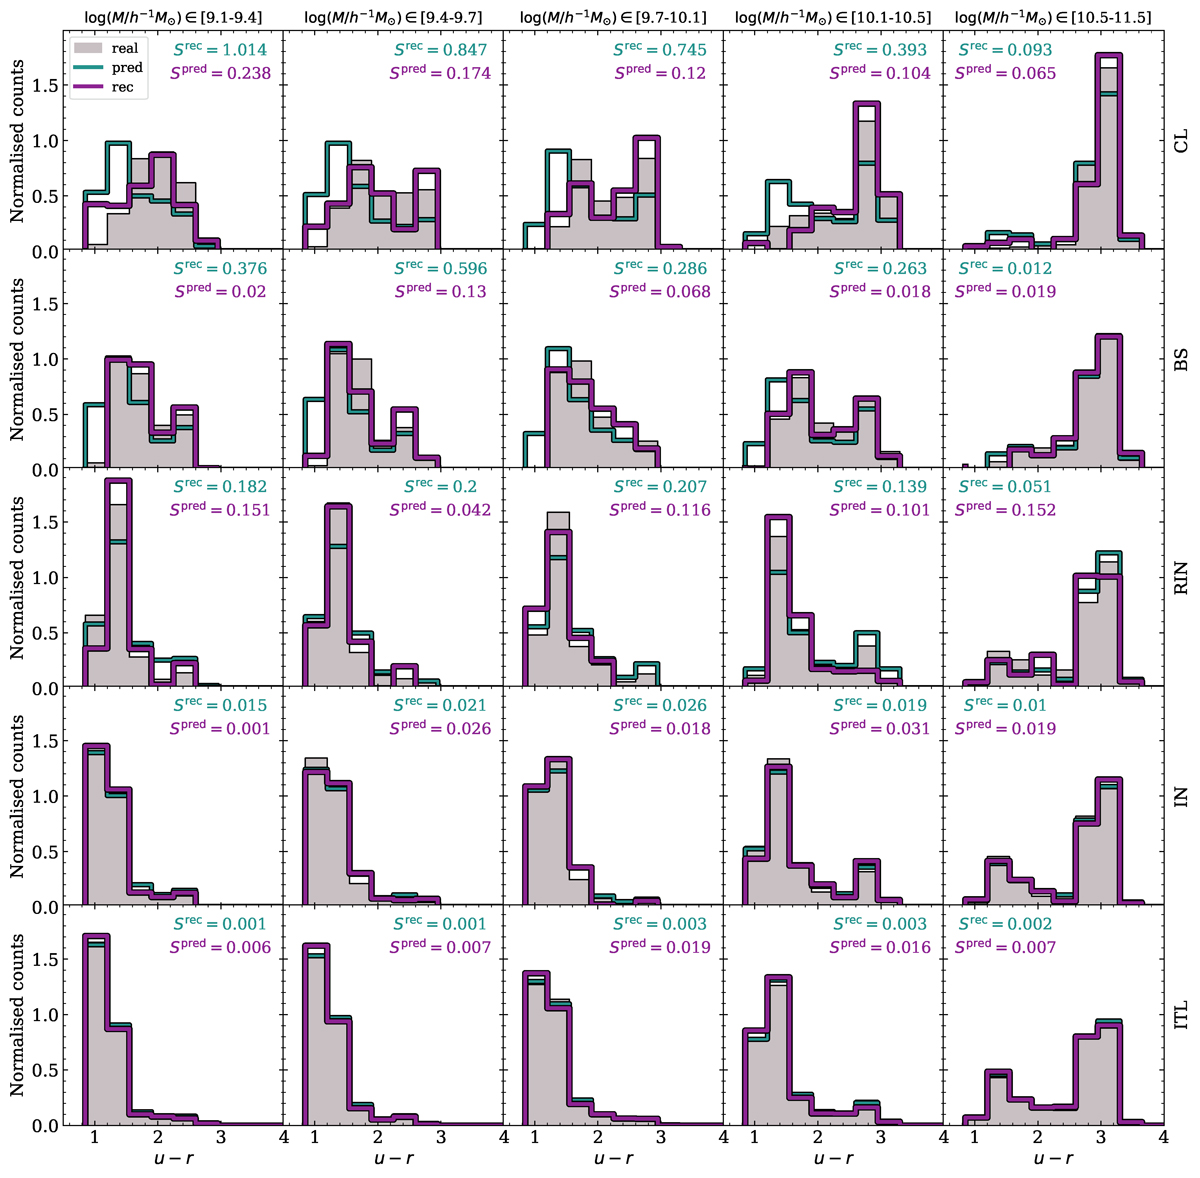
Fig. 2.
Download original image
Colour distributions of galaxies. Each class is shown in a different row, as noted to the right of the panels. Each column considers a particular range of galaxy stellar mass, as noted at the top. Grey shaded histograms are the real colour distributions, i.e. they correspond to the intrinsic classes. Green lines are the colour distributions of the predicted classes. Violet lines are the colour distributions recovered by our method. We quote within each panel the values of the corresponding square residuals, Spred and Srec, given by Eqs. (6) and (7), respectively.
Current usage metrics show cumulative count of Article Views (full-text article views including HTML views, PDF and ePub downloads, according to the available data) and Abstracts Views on Vision4Press platform.
Data correspond to usage on the plateform after 2015. The current usage metrics is available 48-96 hours after online publication and is updated daily on week days.
Initial download of the metrics may take a while.