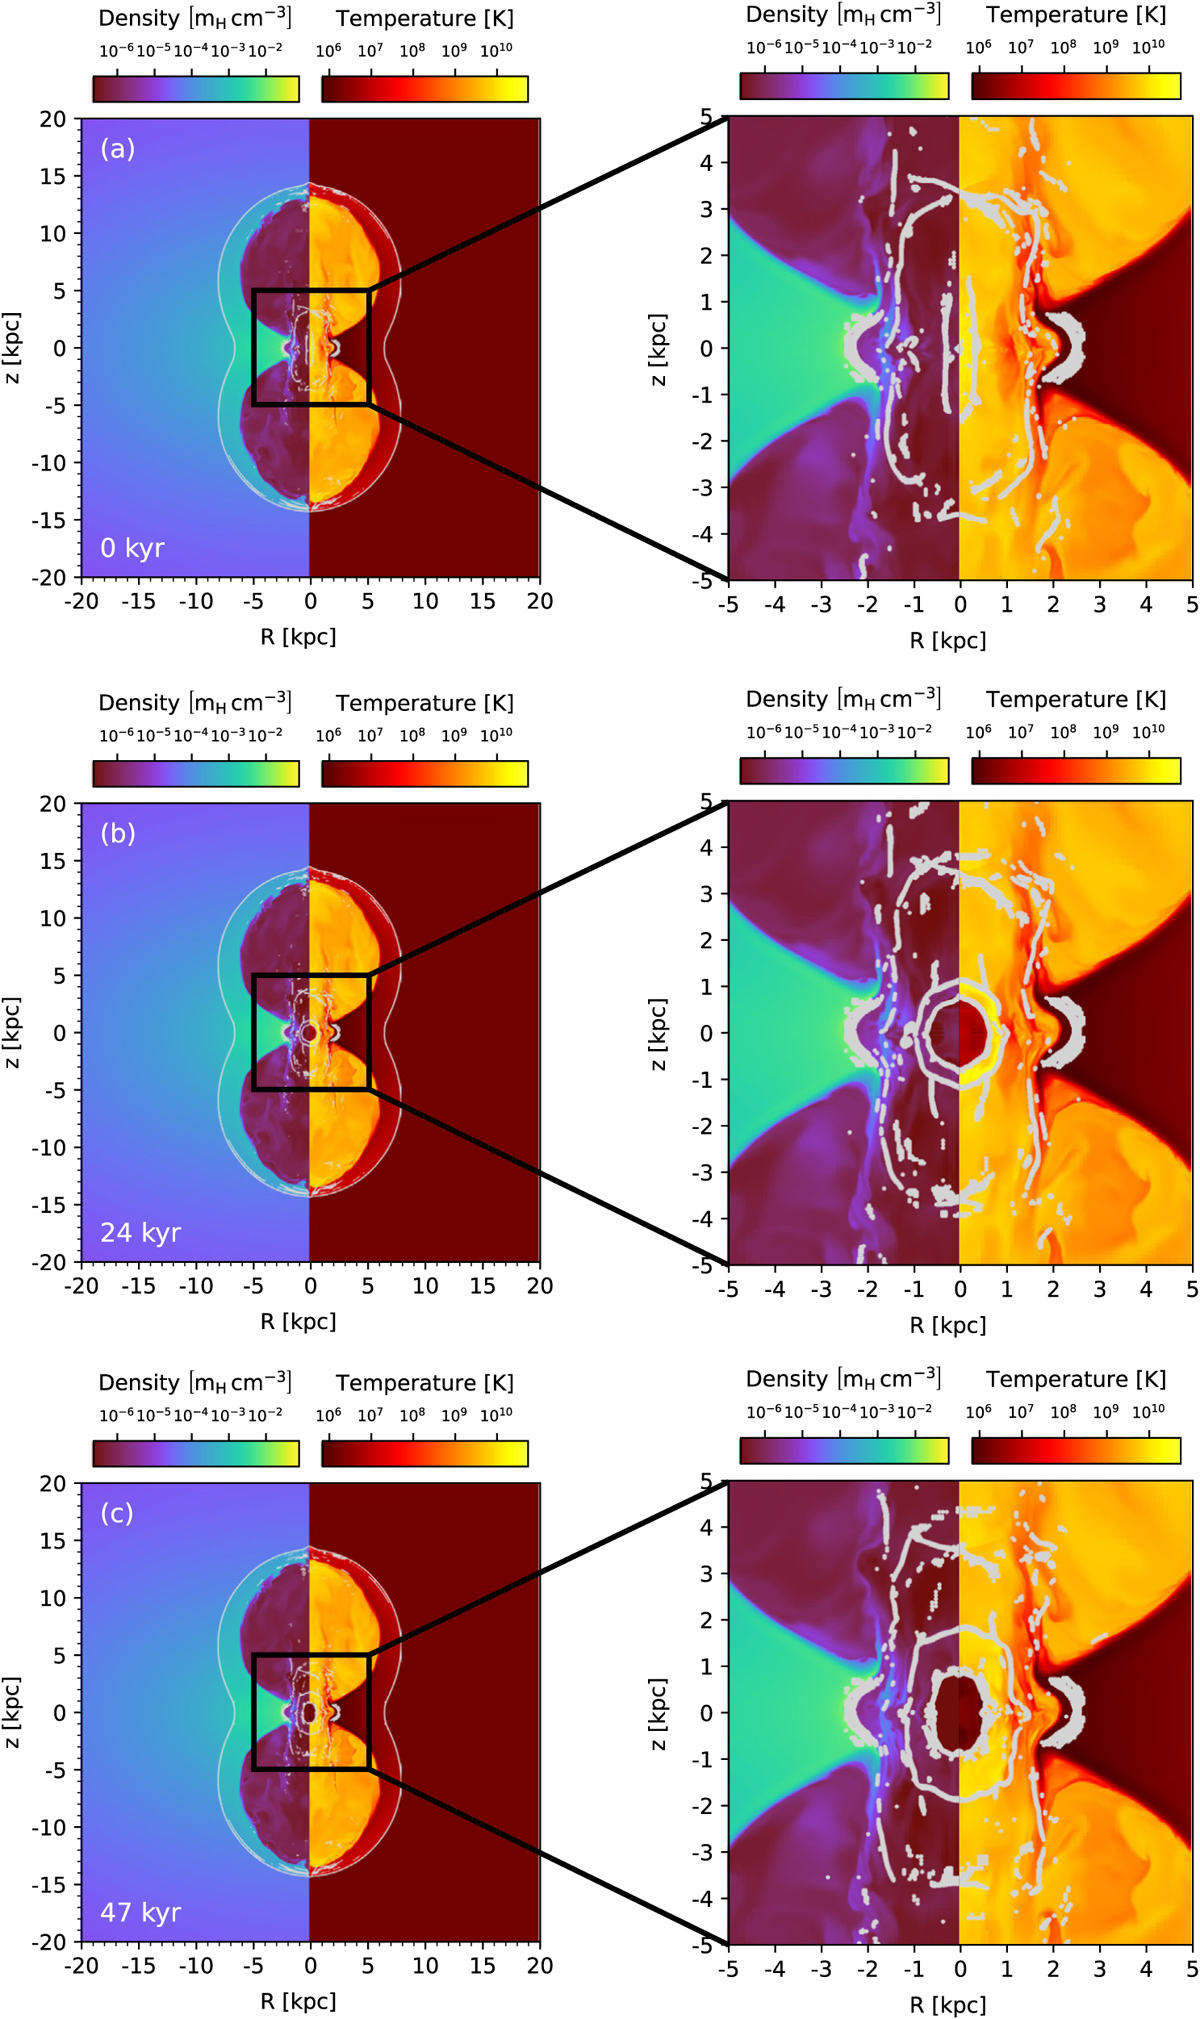
Fig. A.1
Download original image
Shock evolution between two TDEs in the β-model halo bubble. The shocked cells were found using a shock tracer algorithm and were marked by a gray dot. The right column shows a zoom-in of the inner 5 kpc of the left column figures. The elapsed time since the last TDE at 18 Myr is indicated. The next TDE happens shortly before snapshot (f).
Current usage metrics show cumulative count of Article Views (full-text article views including HTML views, PDF and ePub downloads, according to the available data) and Abstracts Views on Vision4Press platform.
Data correspond to usage on the plateform after 2015. The current usage metrics is available 48-96 hours after online publication and is updated daily on week days.
Initial download of the metrics may take a while.