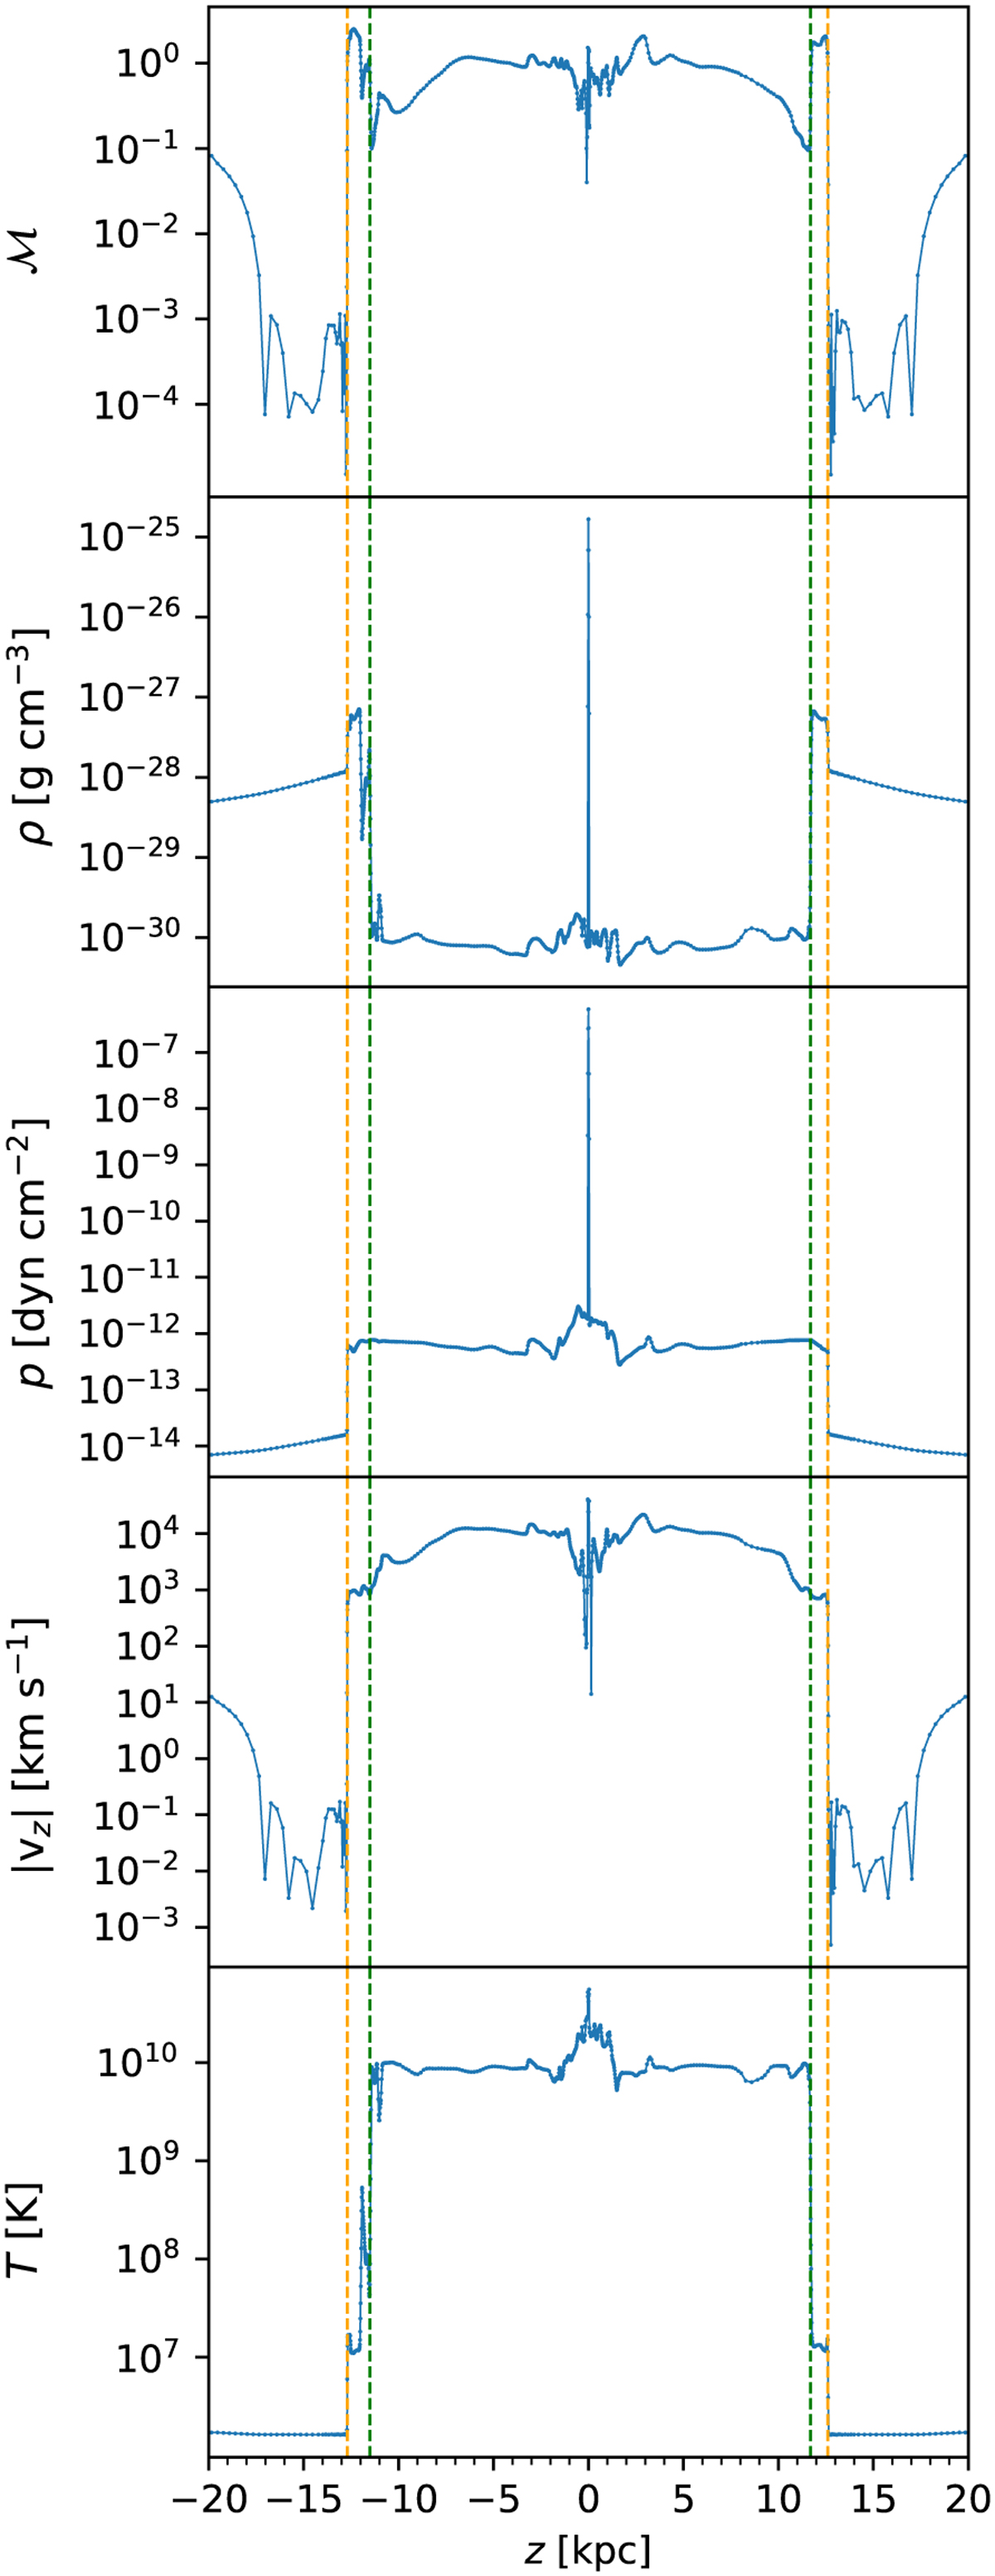
Fig. 5
Download original image
Simulated vertical profiles of the Mach number 𝓜, the density ρ, the pressure p, the absolute value of the flow speed in ɀ-direction υɀ, and the temperature T measured along a ray through the origin (injection region) of TDEs occurring at a rate of 10−5 yr−1 in the β-model halo at l6 Myr. The green and orange dotted lines indicate the position of the contact discontinuity and the forward shock, respectively.
Current usage metrics show cumulative count of Article Views (full-text article views including HTML views, PDF and ePub downloads, according to the available data) and Abstracts Views on Vision4Press platform.
Data correspond to usage on the plateform after 2015. The current usage metrics is available 48-96 hours after online publication and is updated daily on week days.
Initial download of the metrics may take a while.