Fig. 3.
Download original image
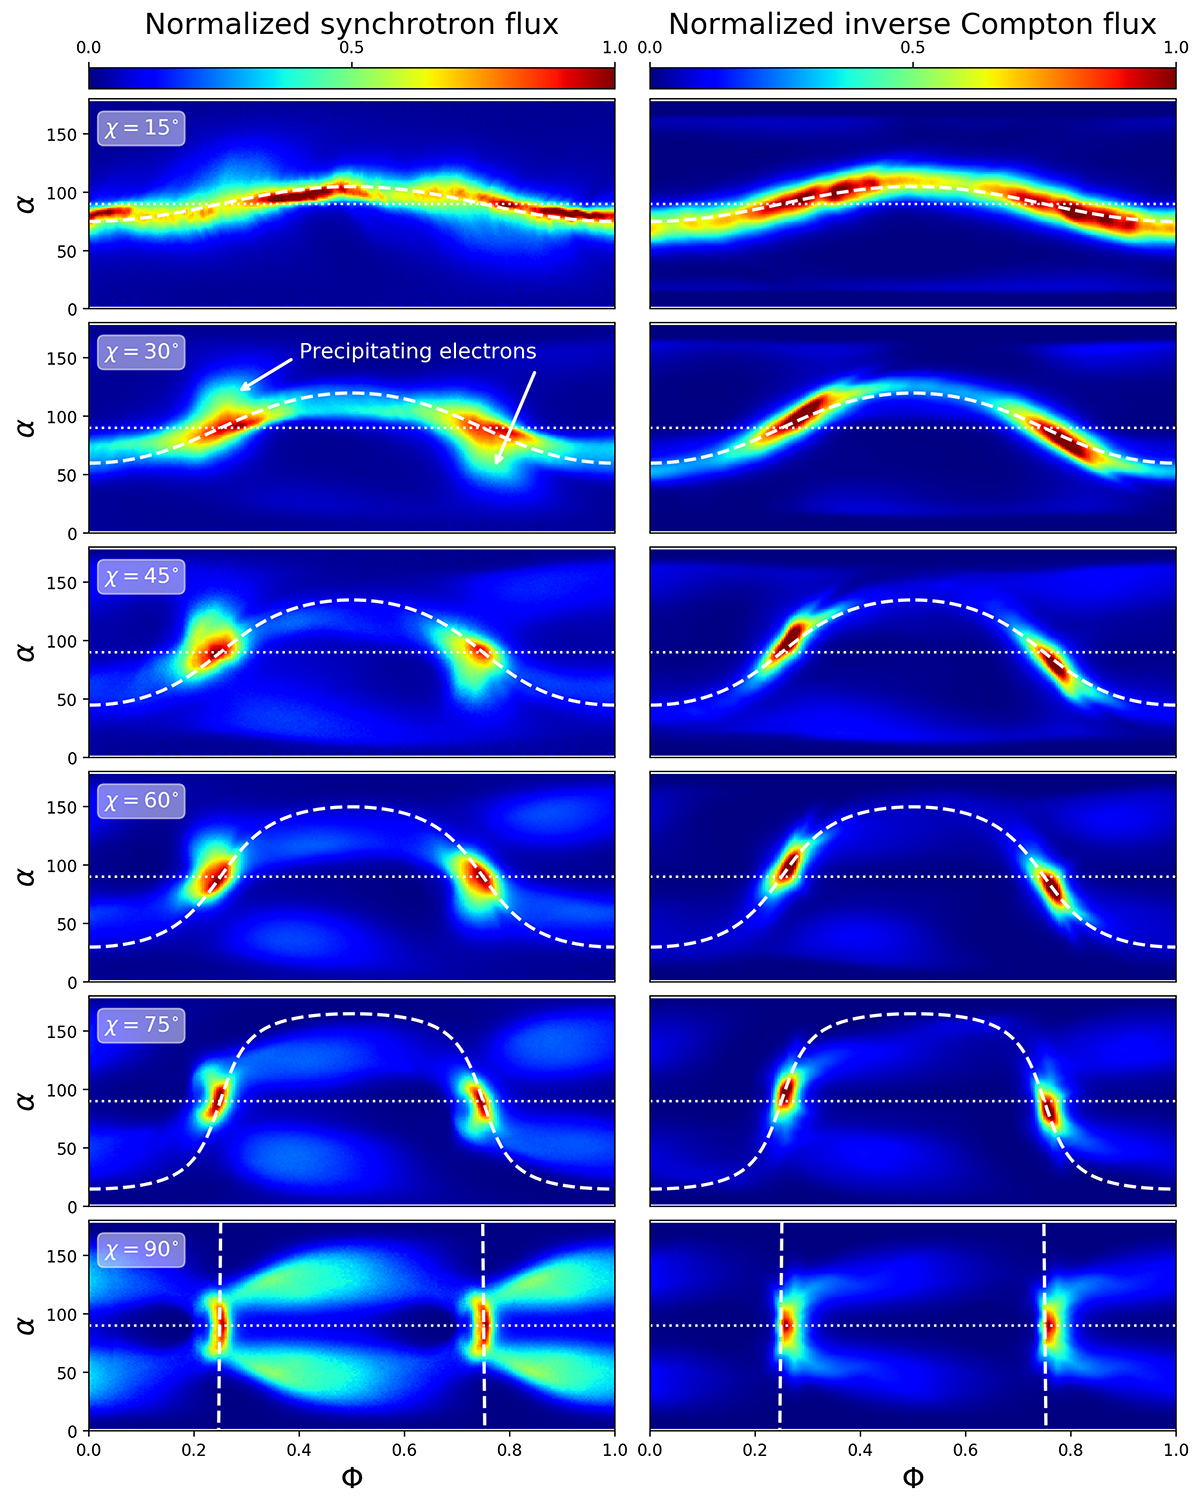
Synthetic synchrotron (left panels) and inverse Compton (isotropic radiation field, right panels) fluxes as a function of the observer’s viewing angle, α, and pulsar phase, Φ. Each map is normalized by its maximum value and includes the emission from both electrons and positrons. The white dashed line represents the location of the current sheet in the split monopole geometry.
Current usage metrics show cumulative count of Article Views (full-text article views including HTML views, PDF and ePub downloads, according to the available data) and Abstracts Views on Vision4Press platform.
Data correspond to usage on the plateform after 2015. The current usage metrics is available 48-96 hours after online publication and is updated daily on week days.
Initial download of the metrics may take a while.