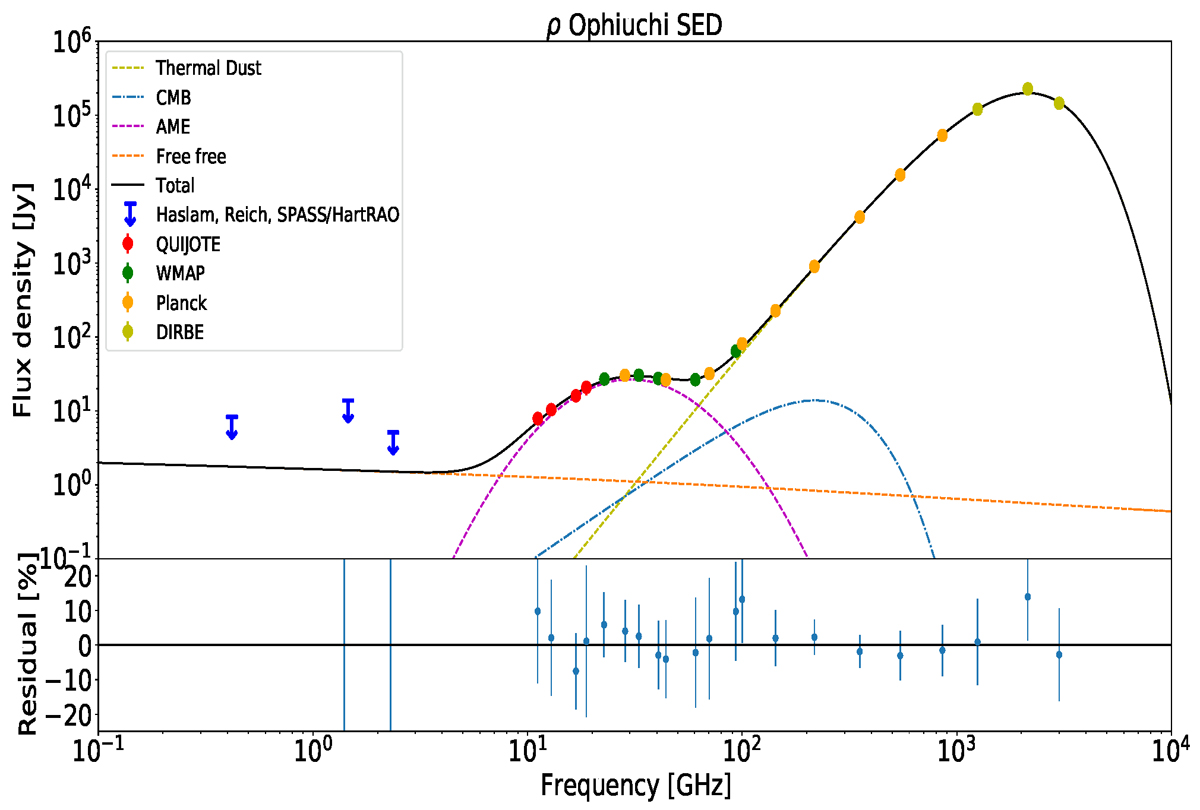
Fig. 9.
Download original image
ρ Ophiuchi intensity SED. QUIJOTE-MFI data points are depicted in red together with other ancillary data (blue), including WMAP 9-yr (green), Planck (orange), and COBE-DIRBE data (light green). At intermediate frequencies, the excess emission associated with the AME clearly shows up. A joint fit has been performed consisting of the following components: free-free (orange line), AME log-normal model (purple line), CMB (blue line), and thermal dust (green-olive line). The black line represents the sum of all components.
Current usage metrics show cumulative count of Article Views (full-text article views including HTML views, PDF and ePub downloads, according to the available data) and Abstracts Views on Vision4Press platform.
Data correspond to usage on the plateform after 2015. The current usage metrics is available 48-96 hours after online publication and is updated daily on week days.
Initial download of the metrics may take a while.