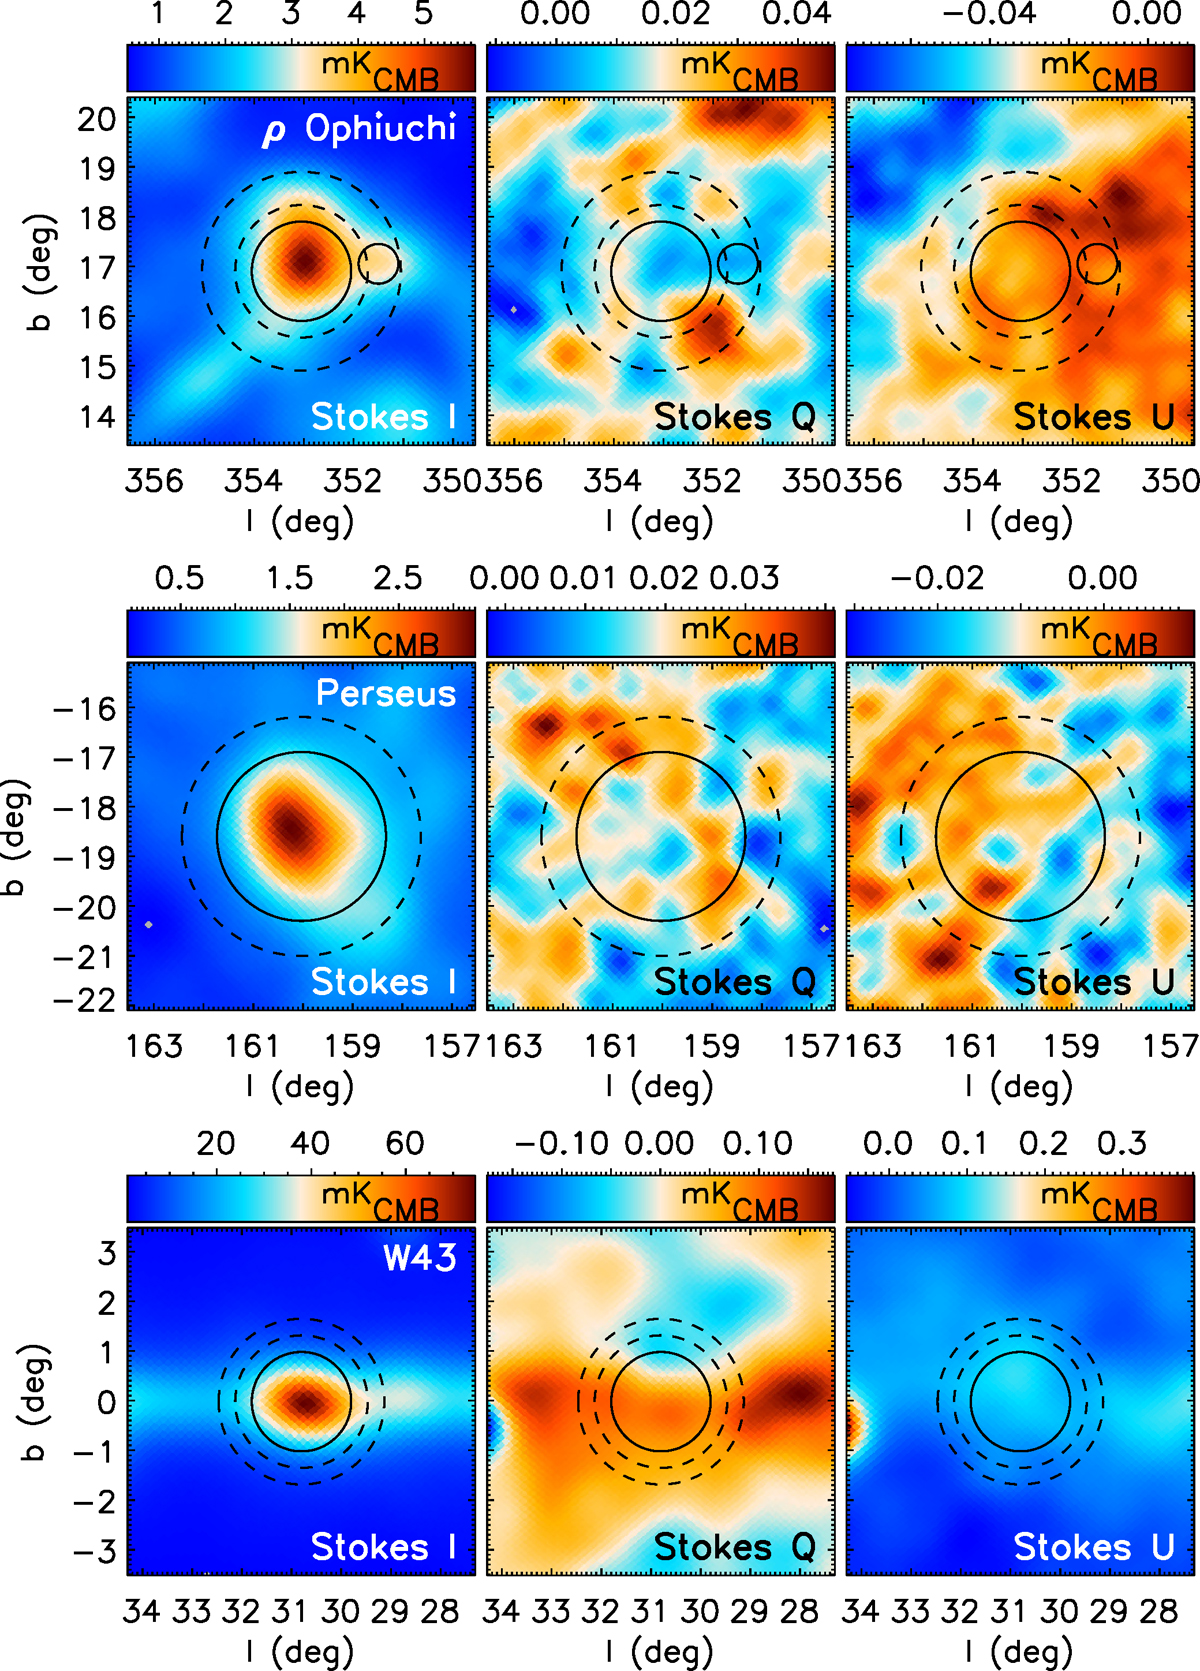
Fig. 8.
Download original image
Intensity and polarisation stacked I, Q, and U maps at a reference frequency of 22.8 GHz and at the position of the three sources studied in this paper. These maps are the result of a weighted average of maps at frequencies around the AME peak frequency convolved at a common angular resolution of 1° and were obtained following the procedure outlined in Sect. 4.4.3.
Current usage metrics show cumulative count of Article Views (full-text article views including HTML views, PDF and ePub downloads, according to the available data) and Abstracts Views on Vision4Press platform.
Data correspond to usage on the plateform after 2015. The current usage metrics is available 48-96 hours after online publication and is updated daily on week days.
Initial download of the metrics may take a while.