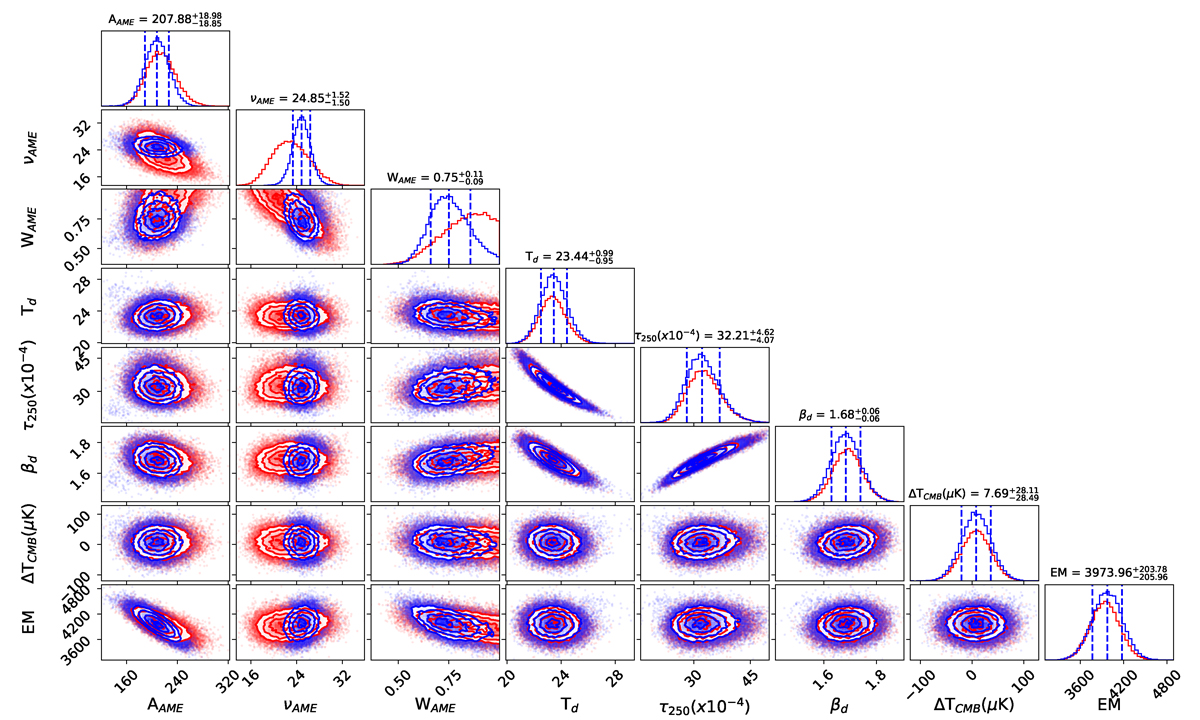
Fig. 6.
Download original image
Example of a corner plot of the two-dimension parameter space explored by the MCMC implemented in the EMCEE package corresponding to the W43 molecular complex. Blue and red contours correspond respectively to the fits with and without QUIJOTE data (see derived best-fit parameters in Table 3). Also shown are one-dimension marginalised posterior distributions from which the best-fit parameters and uncertainties are determined.
Current usage metrics show cumulative count of Article Views (full-text article views including HTML views, PDF and ePub downloads, according to the available data) and Abstracts Views on Vision4Press platform.
Data correspond to usage on the plateform after 2015. The current usage metrics is available 48-96 hours after online publication and is updated daily on week days.
Initial download of the metrics may take a while.