Fig. 5.
Download original image
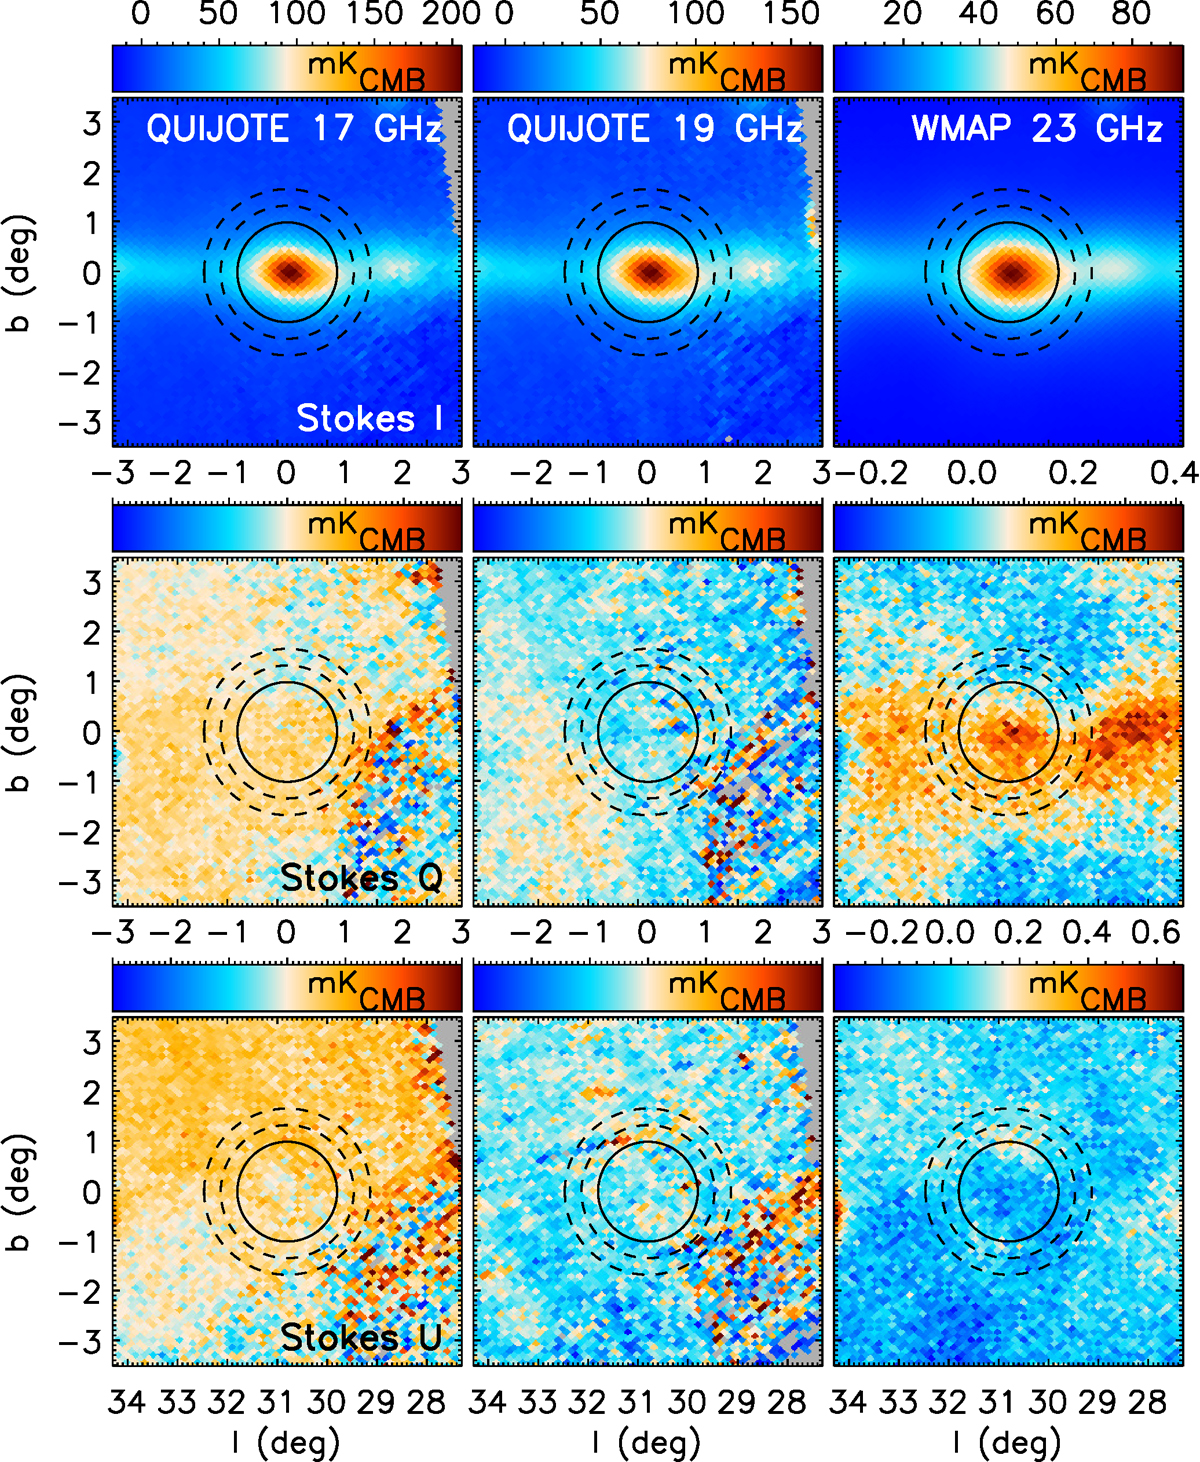
Intensity and polarisation maps around the W43 molecular cloud. The three rows show, respectively, I, Q, and U maps, while the columns correspond to QUIJOTE-MFI 17 (Horn 2) and 19 GHz (Horn 2) and to WMAP 23 GHz, from left to right. The solid circle shows the aperture we used for flux integration, whereas the two dashed circles enclose the ring we used for background subtraction.
Current usage metrics show cumulative count of Article Views (full-text article views including HTML views, PDF and ePub downloads, according to the available data) and Abstracts Views on Vision4Press platform.
Data correspond to usage on the plateform after 2015. The current usage metrics is available 48-96 hours after online publication and is updated daily on week days.
Initial download of the metrics may take a while.