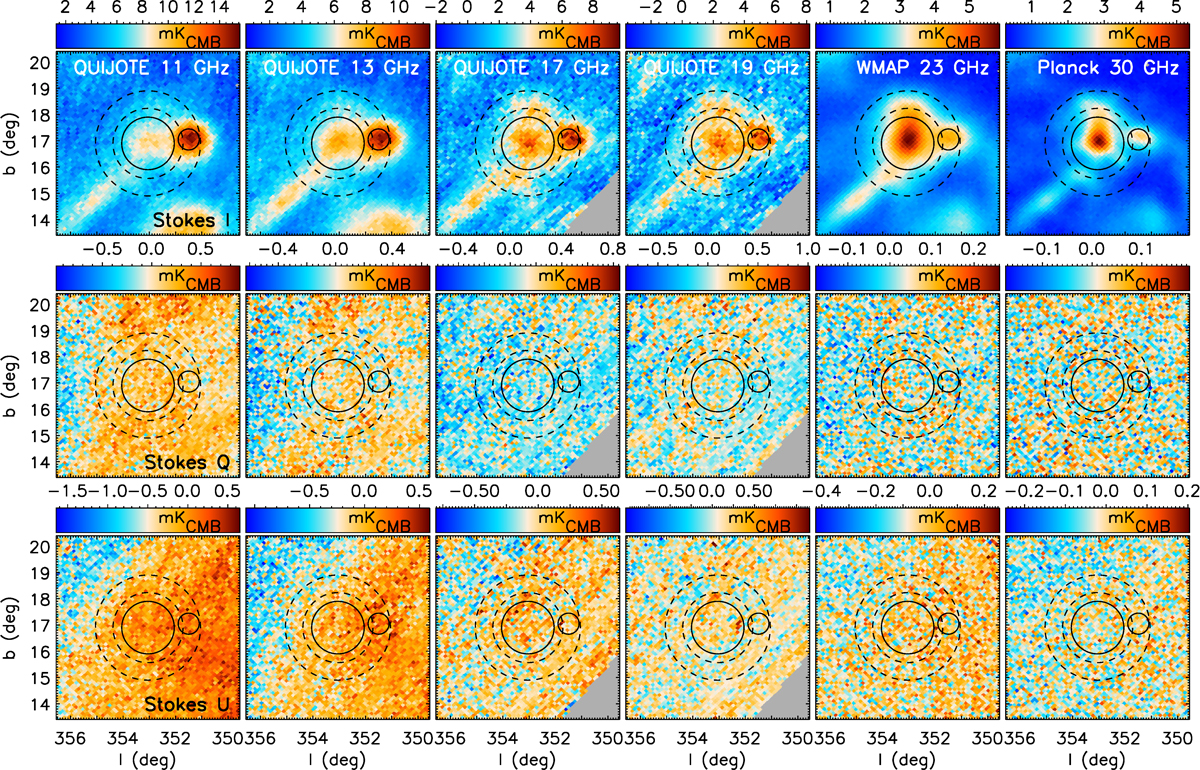
Fig. 3.
Download original image
Intensity and polarisation maps around the ρ Ophiuchi molecular cloud from QUIJOTE-MFI and from the two lowest-frequency bands of WMAP and Planck. The three rows show respectively I, Q and U maps, while the columns correspond to 11, 13, 17 (Horn 2), 19 (Horn 2), 23 and 30 GHz from left to right. The solid circle shows the aperture we used for flux integration, whereas the two dashed circles enclose the ring we used for background subtraction. The small circle inside the background annulus towards the west indicates the mask applied to avoid a strong HII source. The grey areas towards the southwest at 17 and 19 GHz are masked due to satellite contamination. For the sake of better visualisation, these maps are shown at their raw angular resolution, although all the analyses presented in this paper have been performed on maps convolved to a common angular resolution of 1°.
Current usage metrics show cumulative count of Article Views (full-text article views including HTML views, PDF and ePub downloads, according to the available data) and Abstracts Views on Vision4Press platform.
Data correspond to usage on the plateform after 2015. The current usage metrics is available 48-96 hours after online publication and is updated daily on week days.
Initial download of the metrics may take a while.