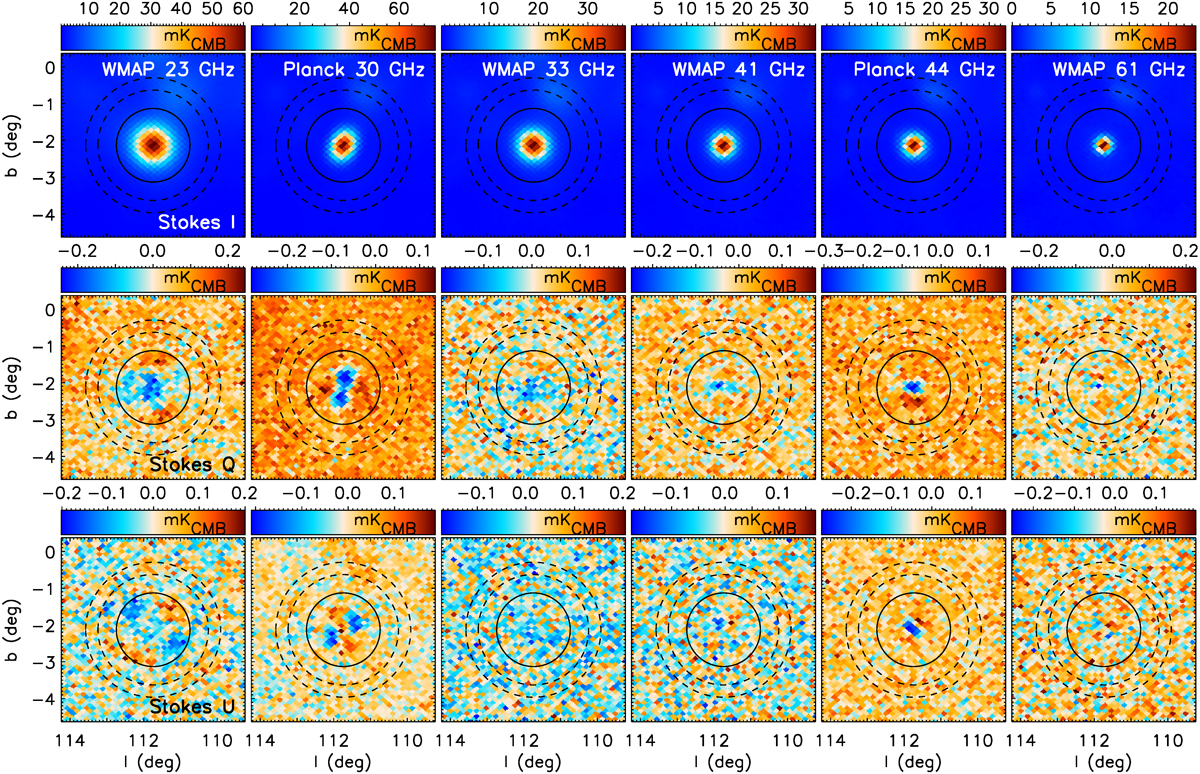
Fig. A.1.
Download original image
WMAP and Planck-LFI total intensity (top row) and polarisation (middle row Stokes Q, bottom row Stokes U) maps at the position of the SNR Cas A. The Q and U polarisation maps show the cloverleaf-shaped pattern typical of beam polarisation. The solid and dashed circles denote the regions we have used for aperture photometry integration and background subtraction to derive the values quoted in Tables A.1 and A.2.
Current usage metrics show cumulative count of Article Views (full-text article views including HTML views, PDF and ePub downloads, according to the available data) and Abstracts Views on Vision4Press platform.
Data correspond to usage on the plateform after 2015. The current usage metrics is available 48-96 hours after online publication and is updated daily on week days.
Initial download of the metrics may take a while.