Fig. 9.
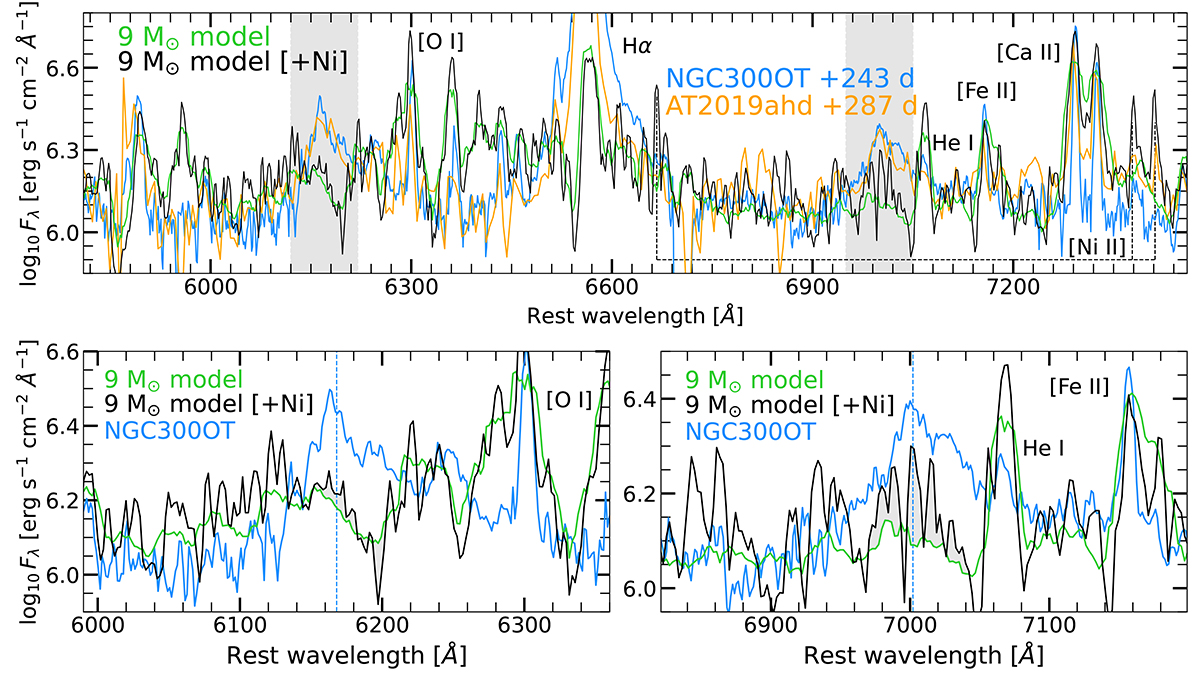
Download original image
Late time spectra of NGC 300 OT compared with models of nebular spectra taken from Jerkstrand et al. (2017). Forbidden [Ni II] lines expected in Ni-rich ejecta are marked with dashed lines. The bottom panels show a zoom onto the region where broad lines are observed in ILRTs. The shaded grey area in the bottom panels highlights the flux difference in the two models.
Current usage metrics show cumulative count of Article Views (full-text article views including HTML views, PDF and ePub downloads, according to the available data) and Abstracts Views on Vision4Press platform.
Data correspond to usage on the plateform after 2015. The current usage metrics is available 48-96 hours after online publication and is updated daily on week days.
Initial download of the metrics may take a while.