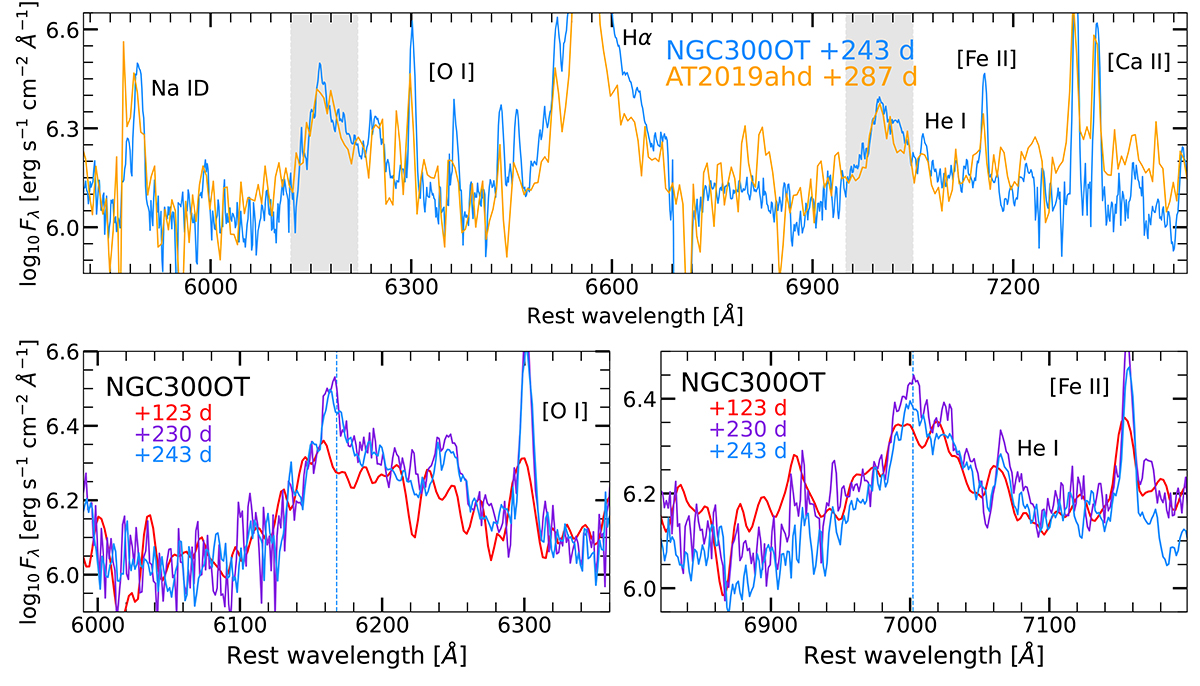
Fig. 8.
Download original image
Late time spectra of NGC 300 OT and AT 2019ahd. A shift in flux has been applied to superimpose the two spectra. The broad features described in the text are highlighted with grey shaded regions. The lower panels show the temporal evolution of these broad features in NGC 300 OT, starting from their first detection. Dashed vertical lines mark the positions of their peaks estimated through a Gaussian fit.
Current usage metrics show cumulative count of Article Views (full-text article views including HTML views, PDF and ePub downloads, according to the available data) and Abstracts Views on Vision4Press platform.
Data correspond to usage on the plateform after 2015. The current usage metrics is available 48-96 hours after online publication and is updated daily on week days.
Initial download of the metrics may take a while.