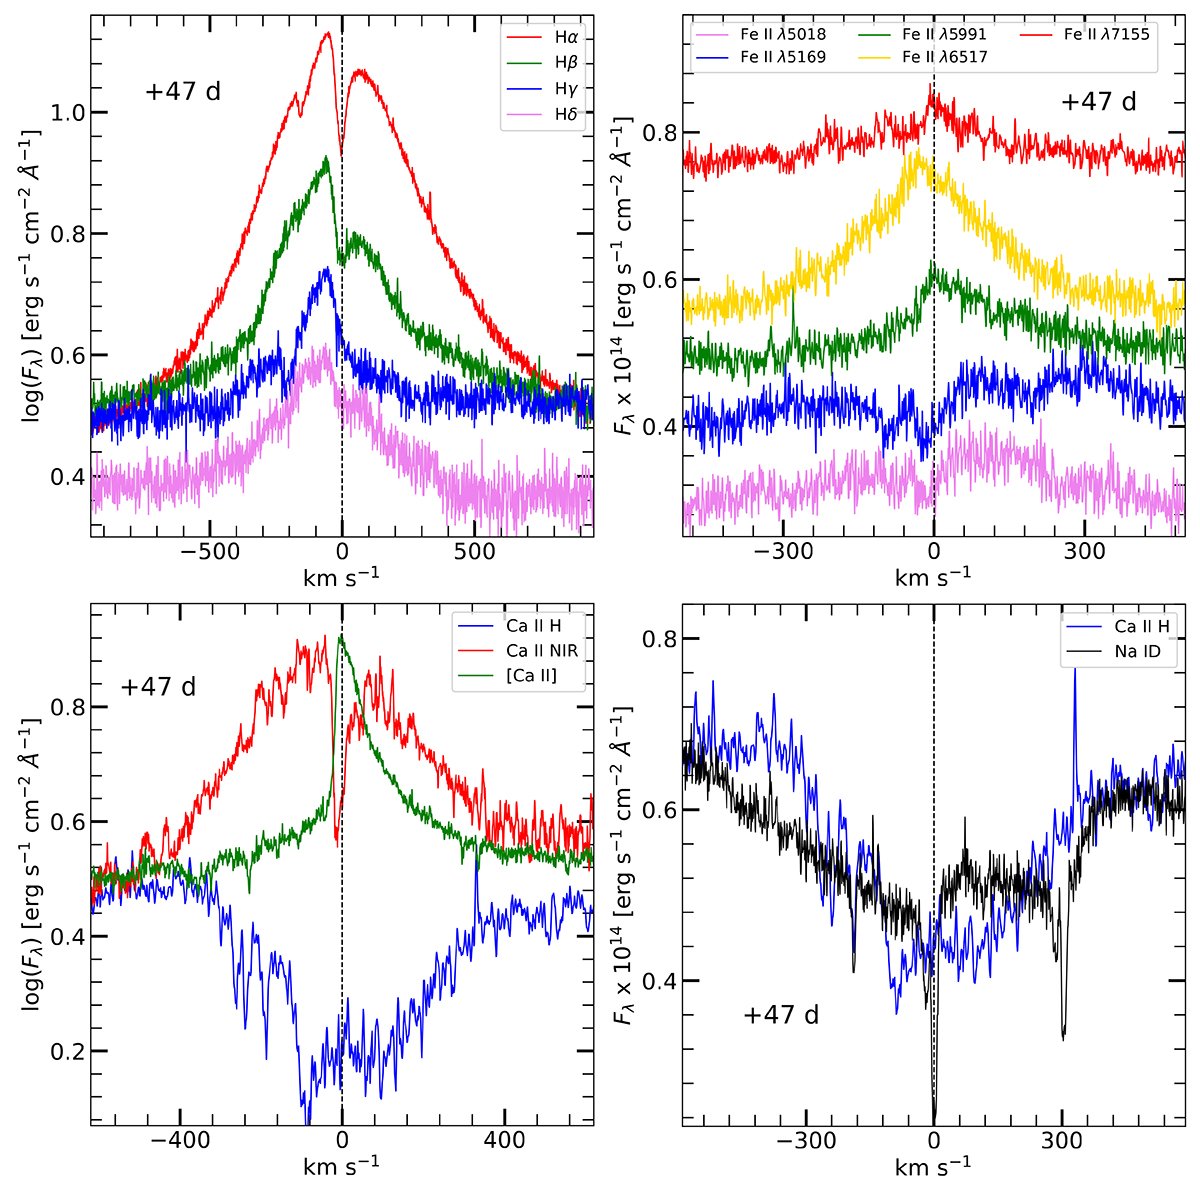
Fig. 7.
Download original image
Most prominent features in the high-resolution spectrum of NGC 300 OT displayed in velocity space. Top left panel: Lines of the Balmer series. Top right panel: Fe II lines. Bottom left panel: Ca II NIR, [Ca II] and Ca II H. Bottom right panel: Complex Na ID absorption features compared with the Ca II H absorption. Spectral features have been scaled in flux for clarity.
Current usage metrics show cumulative count of Article Views (full-text article views including HTML views, PDF and ePub downloads, according to the available data) and Abstracts Views on Vision4Press platform.
Data correspond to usage on the plateform after 2015. The current usage metrics is available 48-96 hours after online publication and is updated daily on week days.
Initial download of the metrics may take a while.