Fig. 2.
Download original image
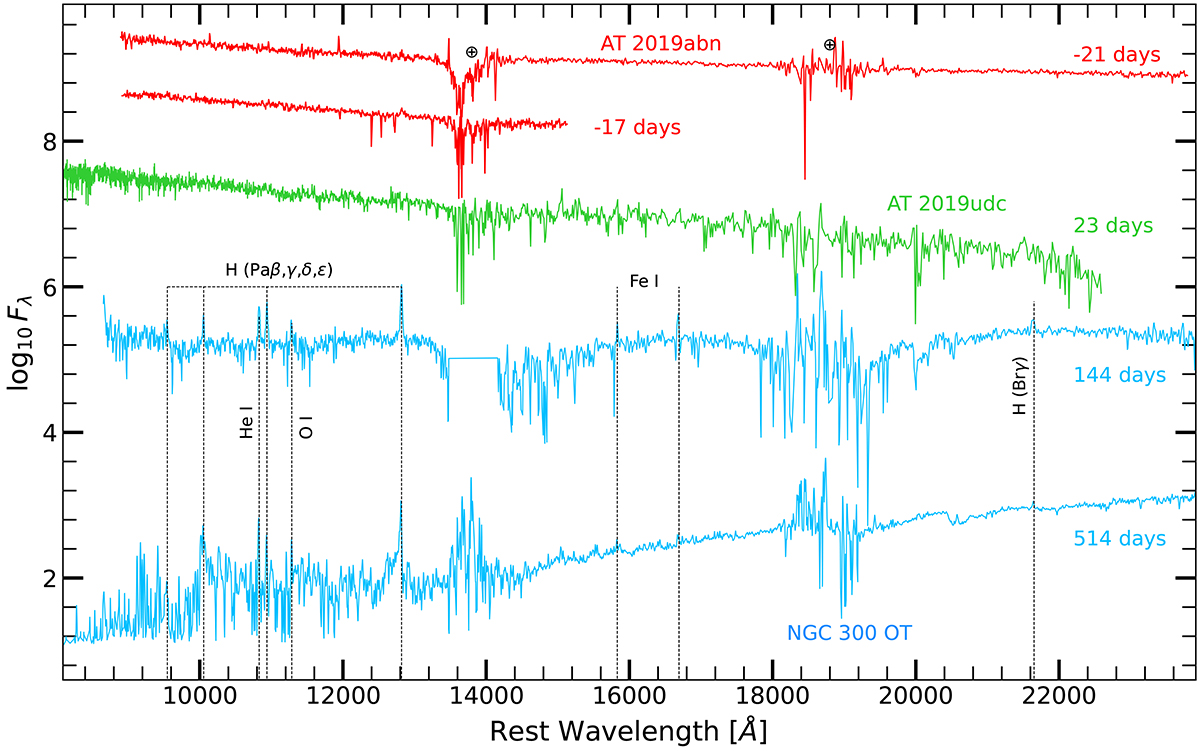
Sequence of NIR spectra collected for our sample of ILRTs. AT 2019abn is shown in red, AT 2019udc in green and NGC 300 OT in blue. The most prominent emission lines are marked on the spectra of NGC 300 OT. The positions of telluric features are marked with a circled plus symbol. The first spectrum of AT 2019abn displayed is the combination of two spectra obtained at phases −21 and −20 days with respect to maximum.
Current usage metrics show cumulative count of Article Views (full-text article views including HTML views, PDF and ePub downloads, according to the available data) and Abstracts Views on Vision4Press platform.
Data correspond to usage on the plateform after 2015. The current usage metrics is available 48-96 hours after online publication and is updated daily on week days.
Initial download of the metrics may take a while.