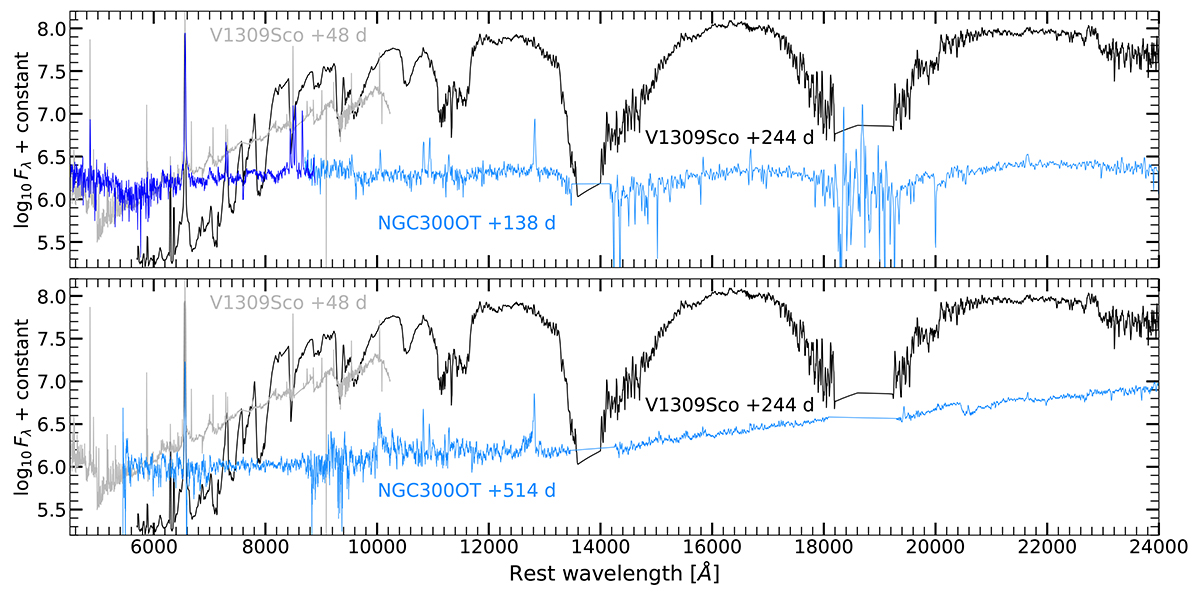
Fig. A.8.
Download original image
Late time NIR spectra of NGC 300 OT compared with V 1309 Sco. In the upper panel, the NIR spectrum of NGC 300 OT taken with TNG+NICS on 2008 October 08 (shown in light blue) is plotted along with the optical spectrum obtained with WHT+ISIS six days later (in blue). For a more detailed spectroscopic evolution of V1309 Sco see Kamiński et al. 2015.
Current usage metrics show cumulative count of Article Views (full-text article views including HTML views, PDF and ePub downloads, according to the available data) and Abstracts Views on Vision4Press platform.
Data correspond to usage on the plateform after 2015. The current usage metrics is available 48-96 hours after online publication and is updated daily on week days.
Initial download of the metrics may take a while.