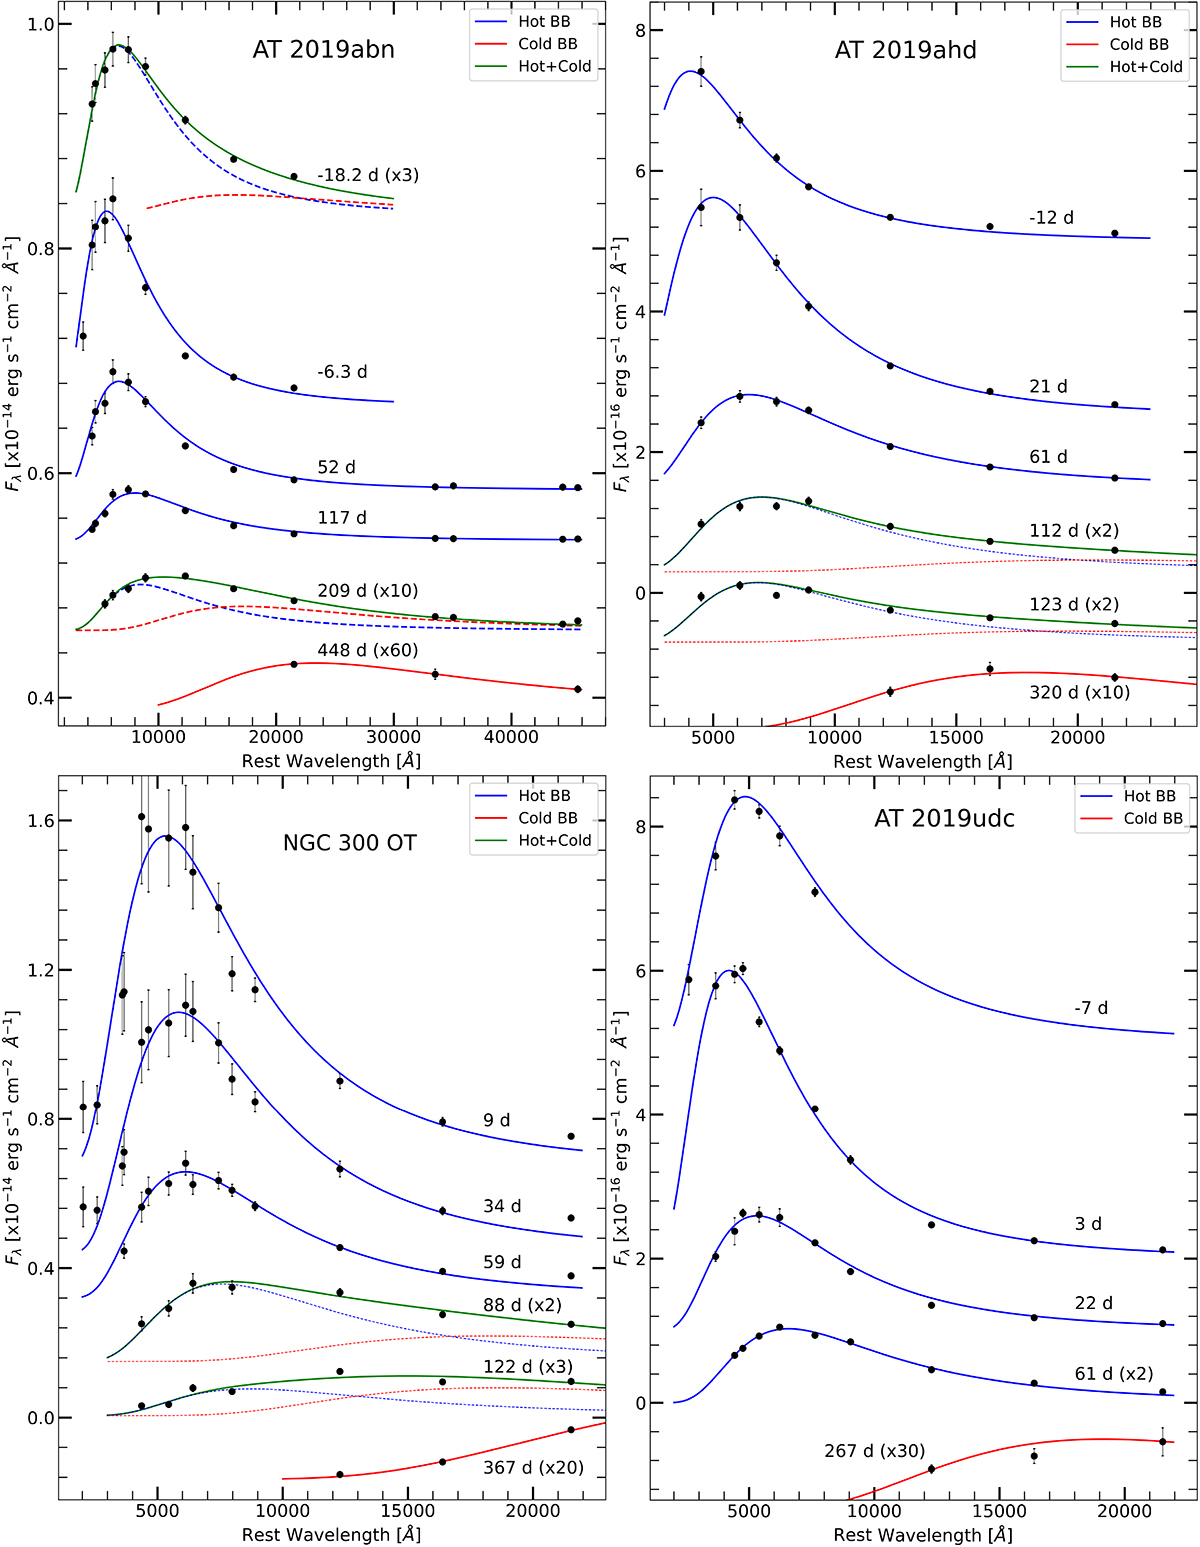
Fig. 7.
Download original image
SED evolution of AT 2019abn, AT 2019ahd, NGC 300 OT, and AT 2019udc. Flux measurements are shown as black circles. In the first phases of their evolution, a single blackbody closely approximates the evolution of the SED. At later phases a second cooler blackbody is needed to reproduce the NIR flux excess. Epochs are reported with respect to maximum light. Flux shifts have been applied for clarity.
Current usage metrics show cumulative count of Article Views (full-text article views including HTML views, PDF and ePub downloads, according to the available data) and Abstracts Views on Vision4Press platform.
Data correspond to usage on the plateform after 2015. The current usage metrics is available 48-96 hours after online publication and is updated daily on week days.
Initial download of the metrics may take a while.