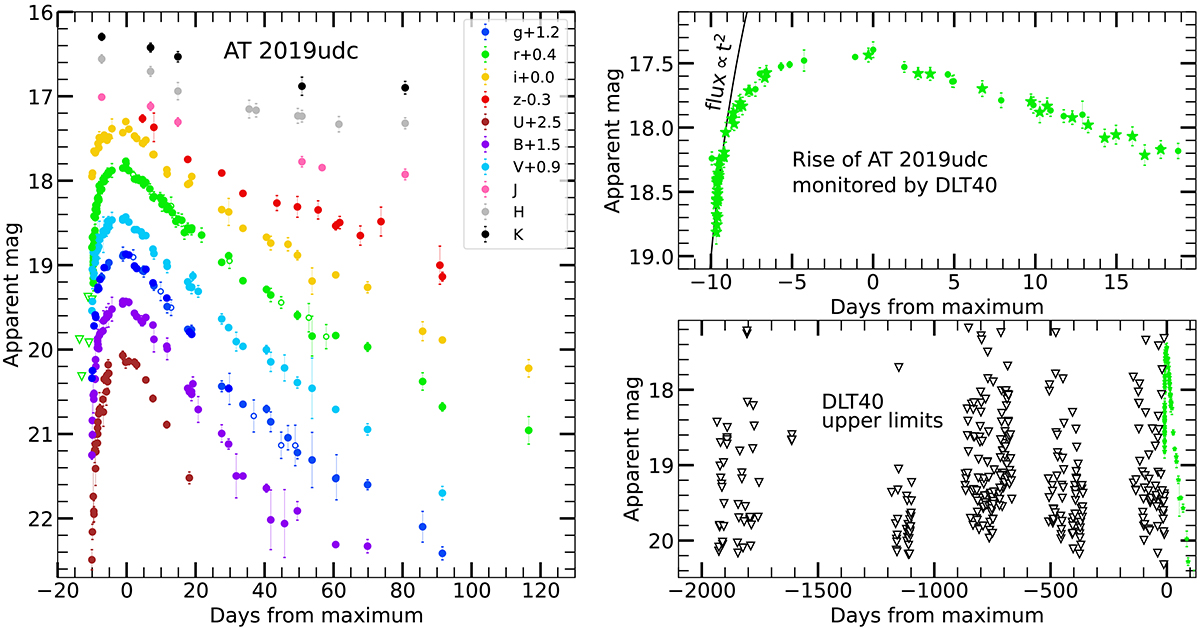
Fig. 3.
Download original image
Photometric data collected for AT 2019udc. In the right panel we present optical and NIR light curves of AT 2019udc. Magnitude shifts have been applied for clarity. Filled circles represent unpublished data, while empty circles represent ZTF data points. In the left panels is shown DLT40 monitoring of AT 2019udc. In particular, in the upper left panel is shown the high-cadence follow-up of the rise of AT 2019udc. The DLT40 data points are shown as stars and are integrated with observations obtained through other facilities, represented as circles. In the lower left, years of upper limits collected by DLT40 are displayed as black triangles, with the detections of the transient appearing as green symbols at the right edge of the figure.
Current usage metrics show cumulative count of Article Views (full-text article views including HTML views, PDF and ePub downloads, according to the available data) and Abstracts Views on Vision4Press platform.
Data correspond to usage on the plateform after 2015. The current usage metrics is available 48-96 hours after online publication and is updated daily on week days.
Initial download of the metrics may take a while.