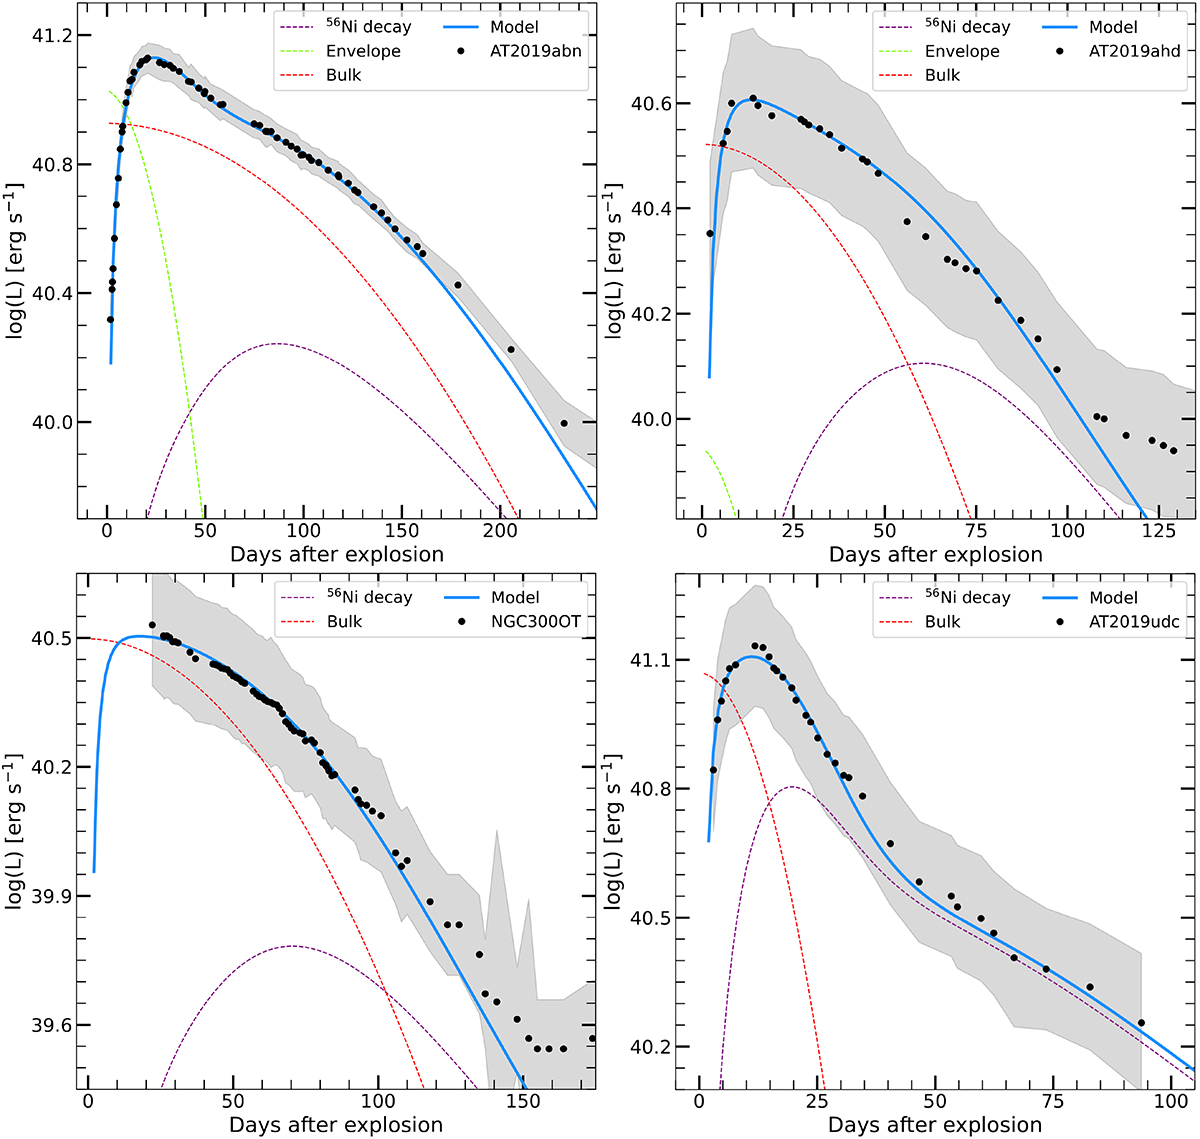
Fig. 15.
Download original image
Bolometric light curves of our sample of ILRTs (represented as black circles) with a toy model reproducing their shape. The errors on the data points, dominated by the uncertainty on distance and reddening estimations, are reported as a grey shaded area. The toy models attempting to reproduce the behaviour of each transient is shown as a solid light blue line. The energy sources powering the different phases of the light curves are shown as dashed lines.
Current usage metrics show cumulative count of Article Views (full-text article views including HTML views, PDF and ePub downloads, according to the available data) and Abstracts Views on Vision4Press platform.
Data correspond to usage on the plateform after 2015. The current usage metrics is available 48-96 hours after online publication and is updated daily on week days.
Initial download of the metrics may take a while.