Fig. 14.
Download original image
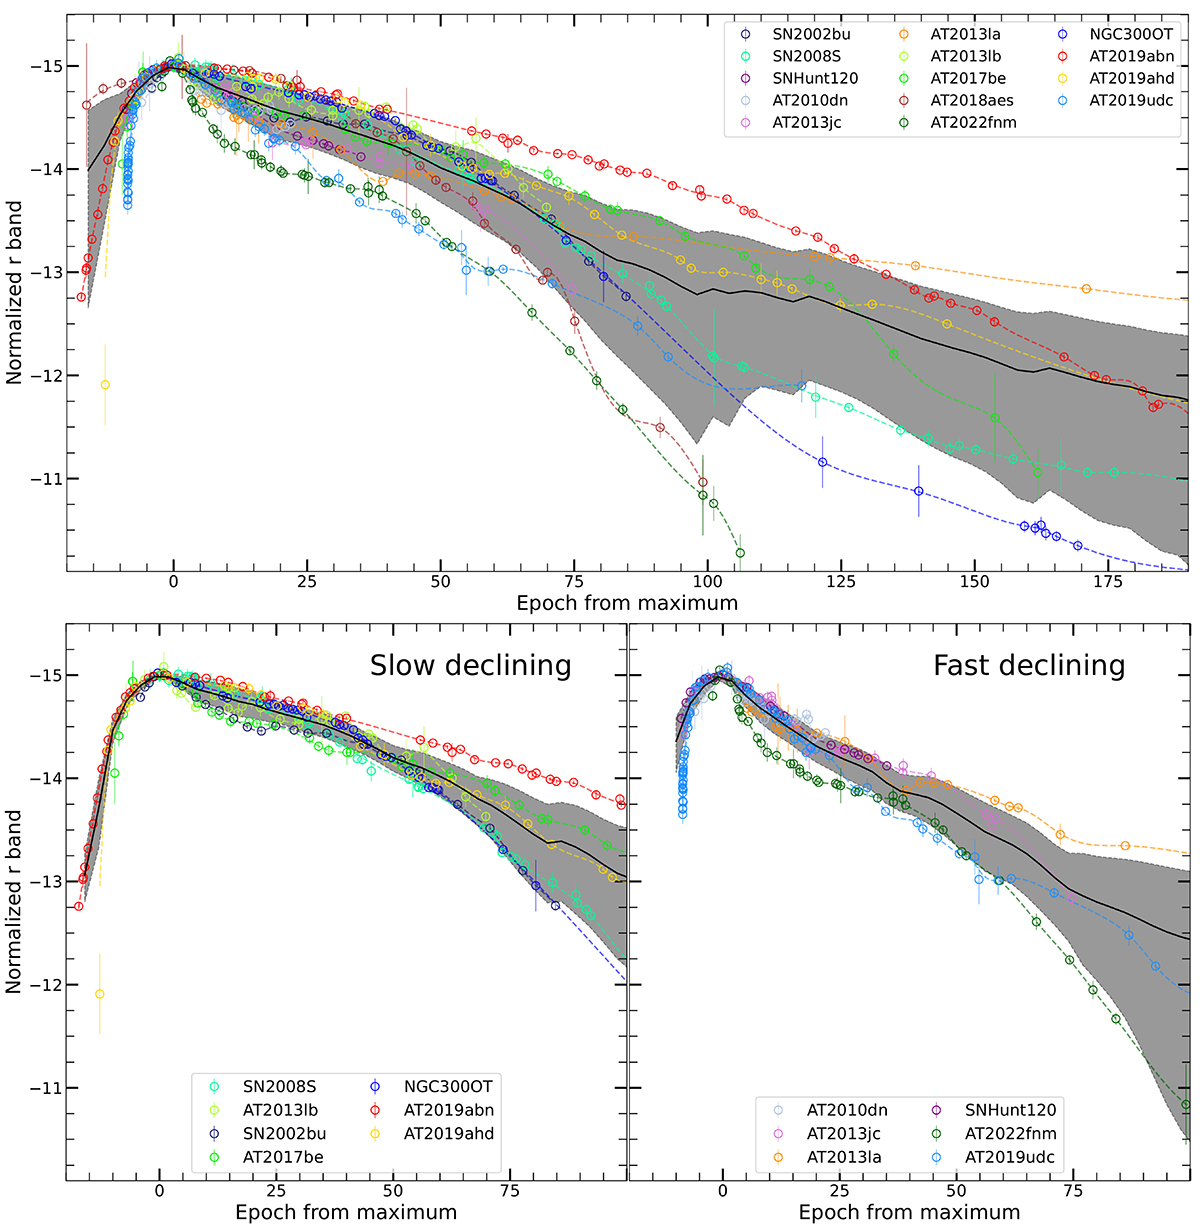
Template light curves obtained for ILRTs. The solid black line represents the ILRTs template light curve, while the grey shaded area shows the 1σ deviation from the mean. The coloured dashed lines display the interpolation performed on each object. In the bottom panels the ILRTs are separated between slow and fast declining objects.
Current usage metrics show cumulative count of Article Views (full-text article views including HTML views, PDF and ePub downloads, according to the available data) and Abstracts Views on Vision4Press platform.
Data correspond to usage on the plateform after 2015. The current usage metrics is available 48-96 hours after online publication and is updated daily on week days.
Initial download of the metrics may take a while.