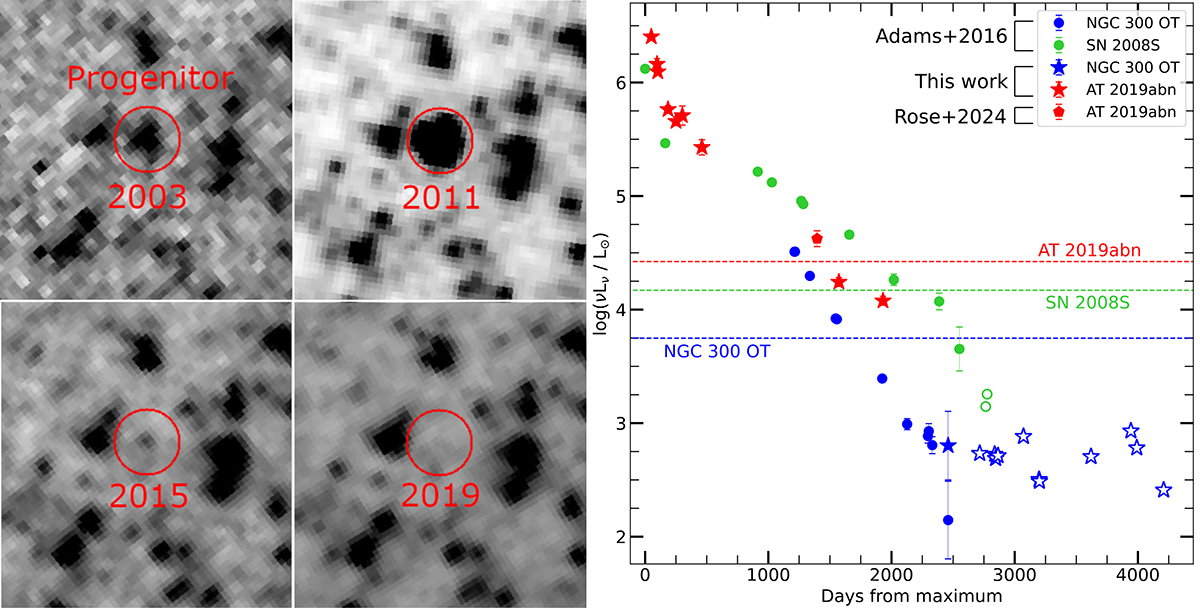
Fig. 13.
Download original image
Late-time MIR evolution of ILRTs. Left panel: Images of NGC 300 OT in the [4.5] μm channel of Spitzer from the progenitor until the disappearance of the transient. Right panel: Updated version of the figure shown in Adams et al. (2016), with their measurements in the [4.5] μm channel shown as circles. Additional data points for NGC 300 OT and AT 2019abn are shown as stars (upper limits are represented as empty symbols). We also show the JWST data point of AT 2019abn obtained by Rose et al. (2024). The progenitor luminosity of each transient is shown as a horizontal dashed line.
Current usage metrics show cumulative count of Article Views (full-text article views including HTML views, PDF and ePub downloads, according to the available data) and Abstracts Views on Vision4Press platform.
Data correspond to usage on the plateform after 2015. The current usage metrics is available 48-96 hours after online publication and is updated daily on week days.
Initial download of the metrics may take a while.