Open Access
Fig. 12.
Download original image
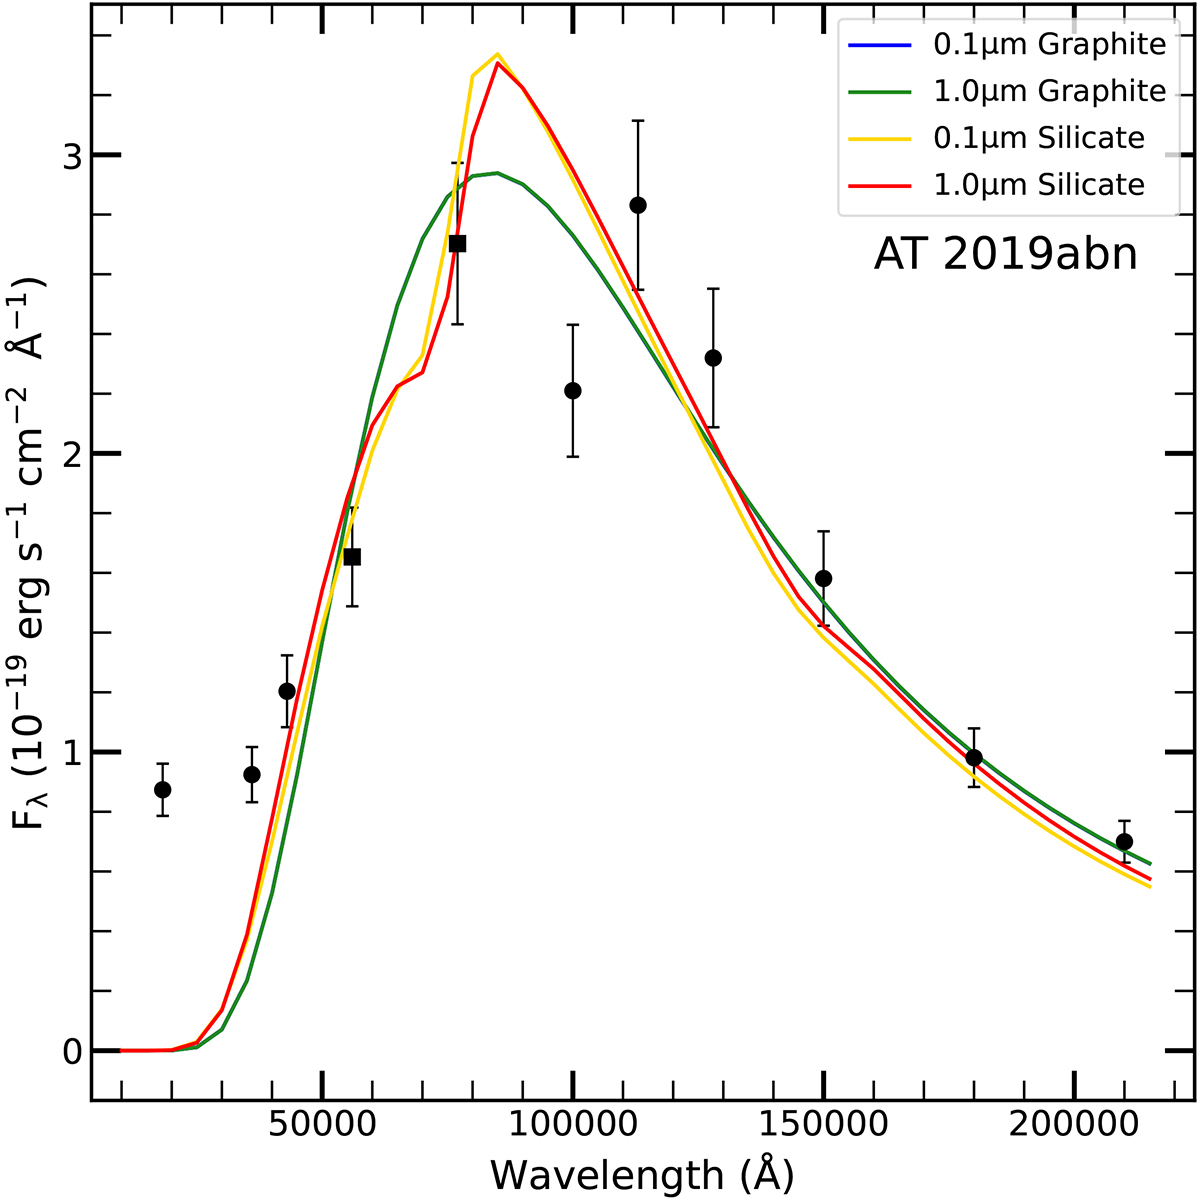
SED of AT 2019abn 1956 days after discovery. The circles represent flux measurements obtained with JWST on 2024 May 31, while the squares represent data extrapolated from the measurements on 2023 June 08. The solid lines are the best fits for dust with different composition and grain size.
Current usage metrics show cumulative count of Article Views (full-text article views including HTML views, PDF and ePub downloads, according to the available data) and Abstracts Views on Vision4Press platform.
Data correspond to usage on the plateform after 2015. The current usage metrics is available 48-96 hours after online publication and is updated daily on week days.
Initial download of the metrics may take a while.