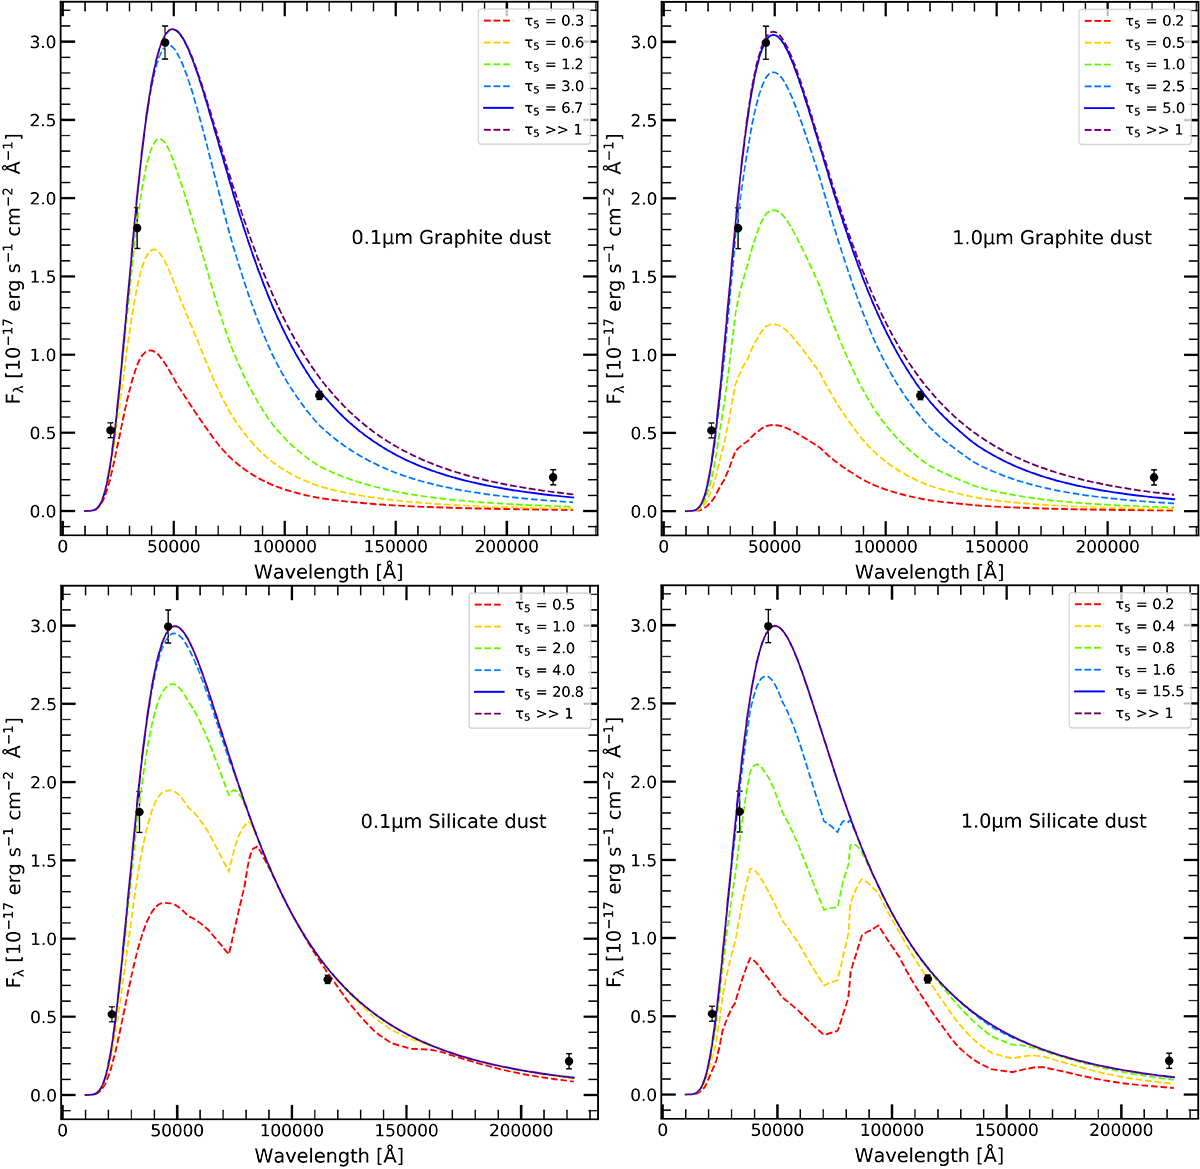
Fig. 11.
Download original image
Fits to the late-time SED of NGC 300 OT obtained 761 days after maximum. In the different panels are reported the fits for the different dust compositions and grain sizes. The best fit to the data is shown as a solid blue line, while the dashed lines show the effect of changes in the optical depth while keeping temperature and radius of the source fixed.
Current usage metrics show cumulative count of Article Views (full-text article views including HTML views, PDF and ePub downloads, according to the available data) and Abstracts Views on Vision4Press platform.
Data correspond to usage on the plateform after 2015. The current usage metrics is available 48-96 hours after online publication and is updated daily on week days.
Initial download of the metrics may take a while.