Open Access
Fig. 10.
Download original image
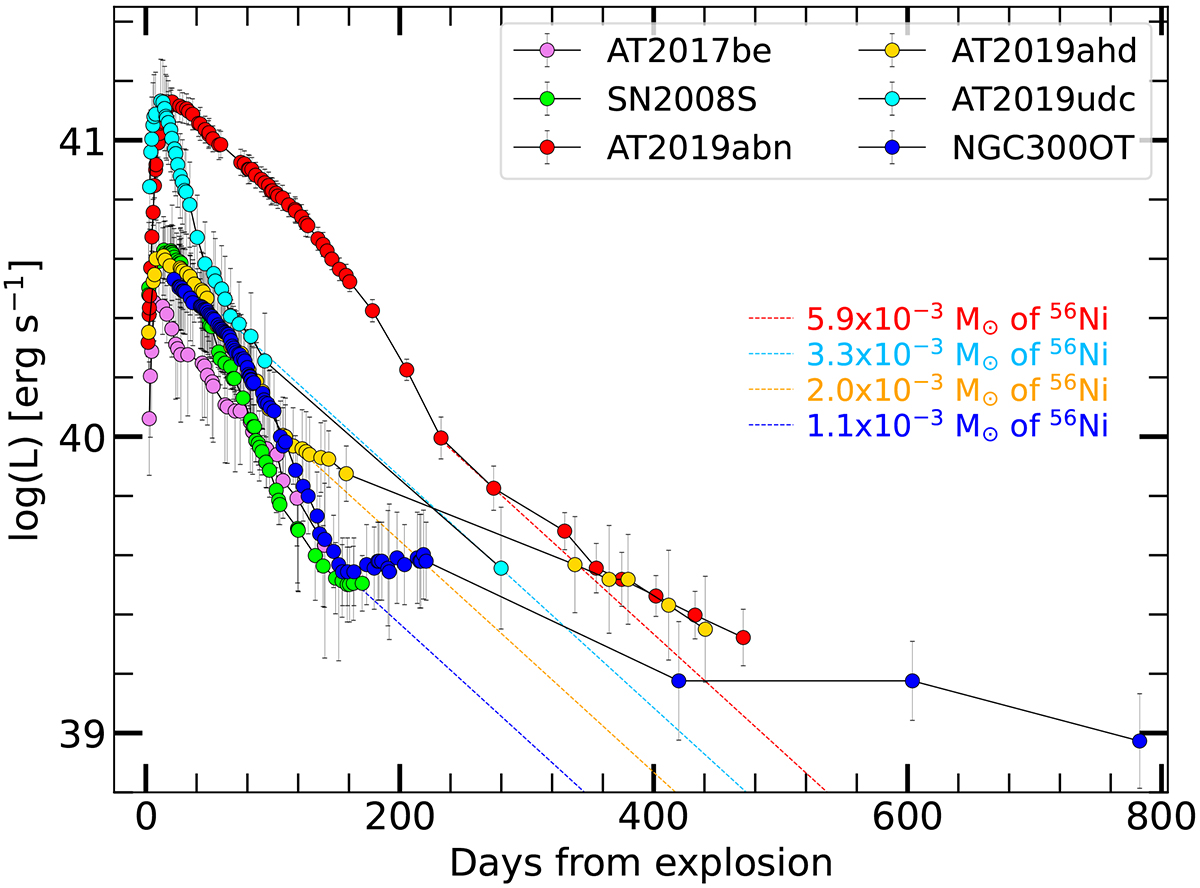
Bolometric light curves of our sample of ILRTs, together with SN 2008S and AT 2017be. The coloured dotted lines show the 56Ni decline rates for the upper limits estimated for each object in oursample.
Current usage metrics show cumulative count of Article Views (full-text article views including HTML views, PDF and ePub downloads, according to the available data) and Abstracts Views on Vision4Press platform.
Data correspond to usage on the plateform after 2015. The current usage metrics is available 48-96 hours after online publication and is updated daily on week days.
Initial download of the metrics may take a while.