Open Access
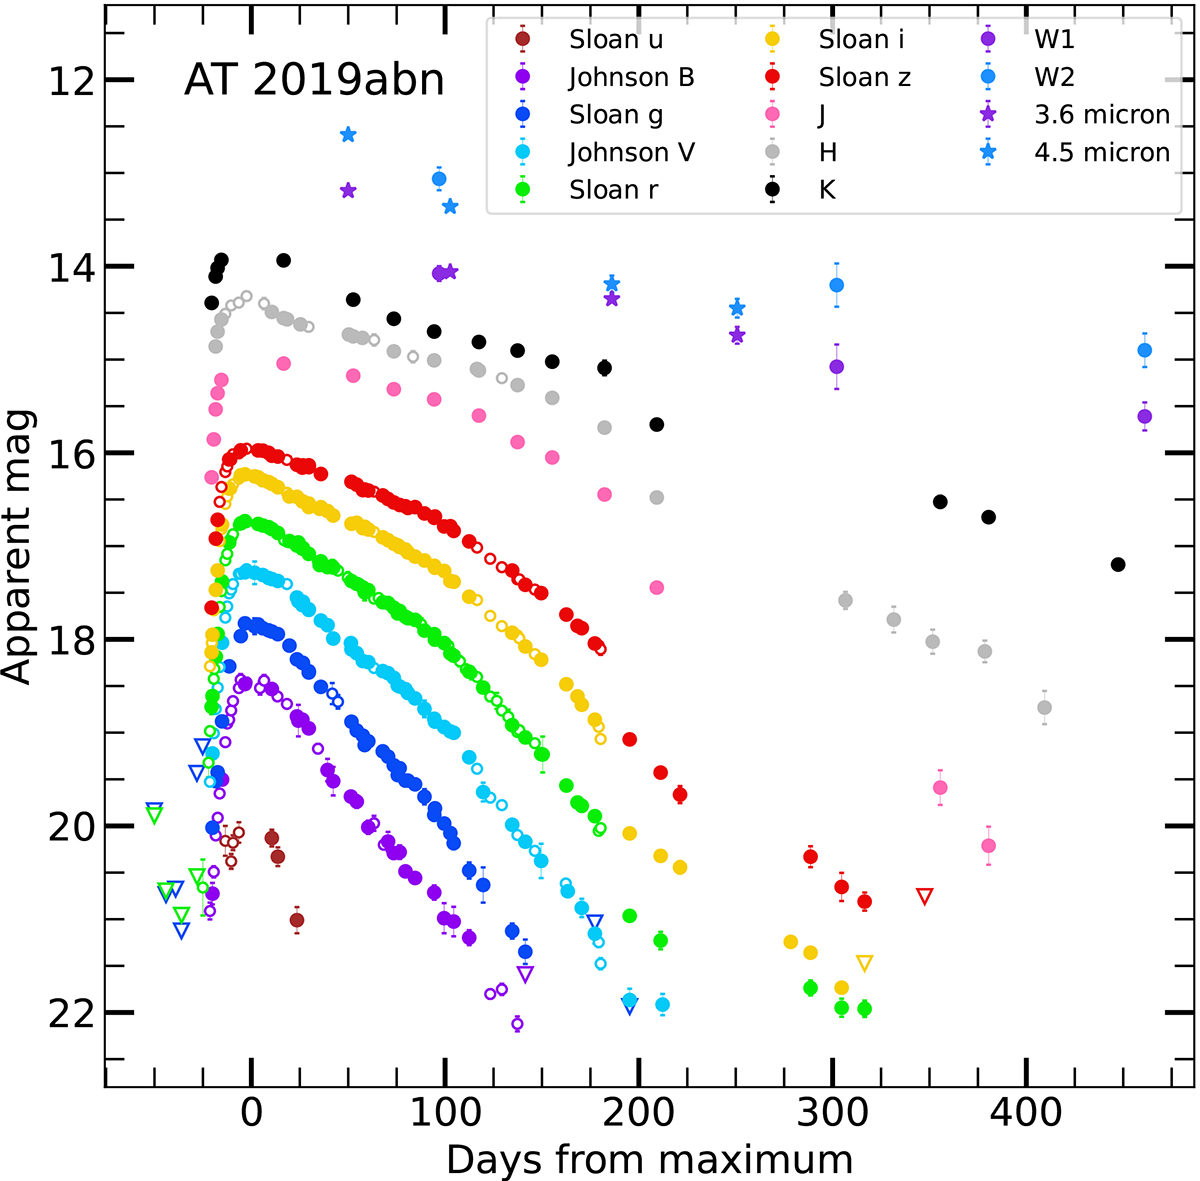
Fig. 1.
Download original image
Optical, NIR, and MIR light curves of AT 2019abn. The filled circles represent the unpublished data, while the empty circles represent the data points from the literature. The empty triangles represent the upper limits.
Current usage metrics show cumulative count of Article Views (full-text article views including HTML views, PDF and ePub downloads, according to the available data) and Abstracts Views on Vision4Press platform.
Data correspond to usage on the plateform after 2015. The current usage metrics is available 48-96 hours after online publication and is updated daily on week days.
Initial download of the metrics may take a while.