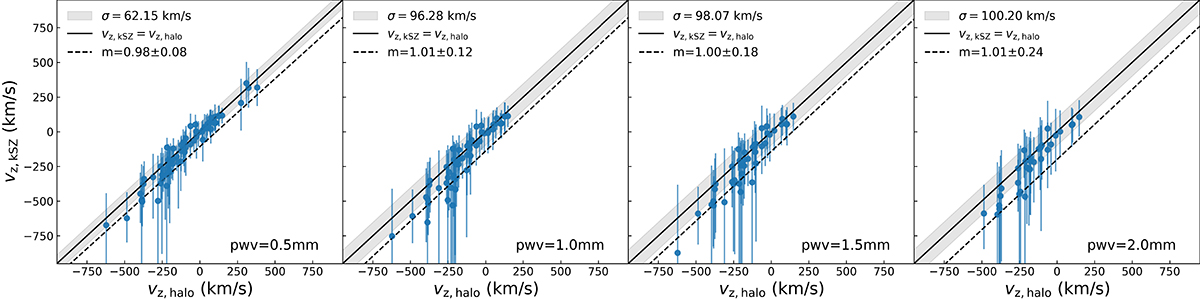
Fig. 9.
Download original image
Comparison between vz, halo and vz, kSZ under different weather conditions (pwv = 0.5 mm, 1.0 mm, 1.5 mm, and 2.0 mm) with given bounds for kT for a 30-meter radio telescope. The results in these four figures are based on measurements with an aperture size of R200. The solid lines represent vz, kSZ = vz, halo, and the gray regions represent the rms scatters of the vz, kSZ = vz, halo lines at a given x-axis for all galaxy clusters in our sample. The dashed lines are the best-fit lines of the data points excluding |vz, kSZ|> 500 km s−1, and ‘m’ in the legends are the slopes of the best-fit lines.
Current usage metrics show cumulative count of Article Views (full-text article views including HTML views, PDF and ePub downloads, according to the available data) and Abstracts Views on Vision4Press platform.
Data correspond to usage on the plateform after 2015. The current usage metrics is available 48-96 hours after online publication and is updated daily on week days.
Initial download of the metrics may take a while.