Open Access
Fig. 3.
Download original image
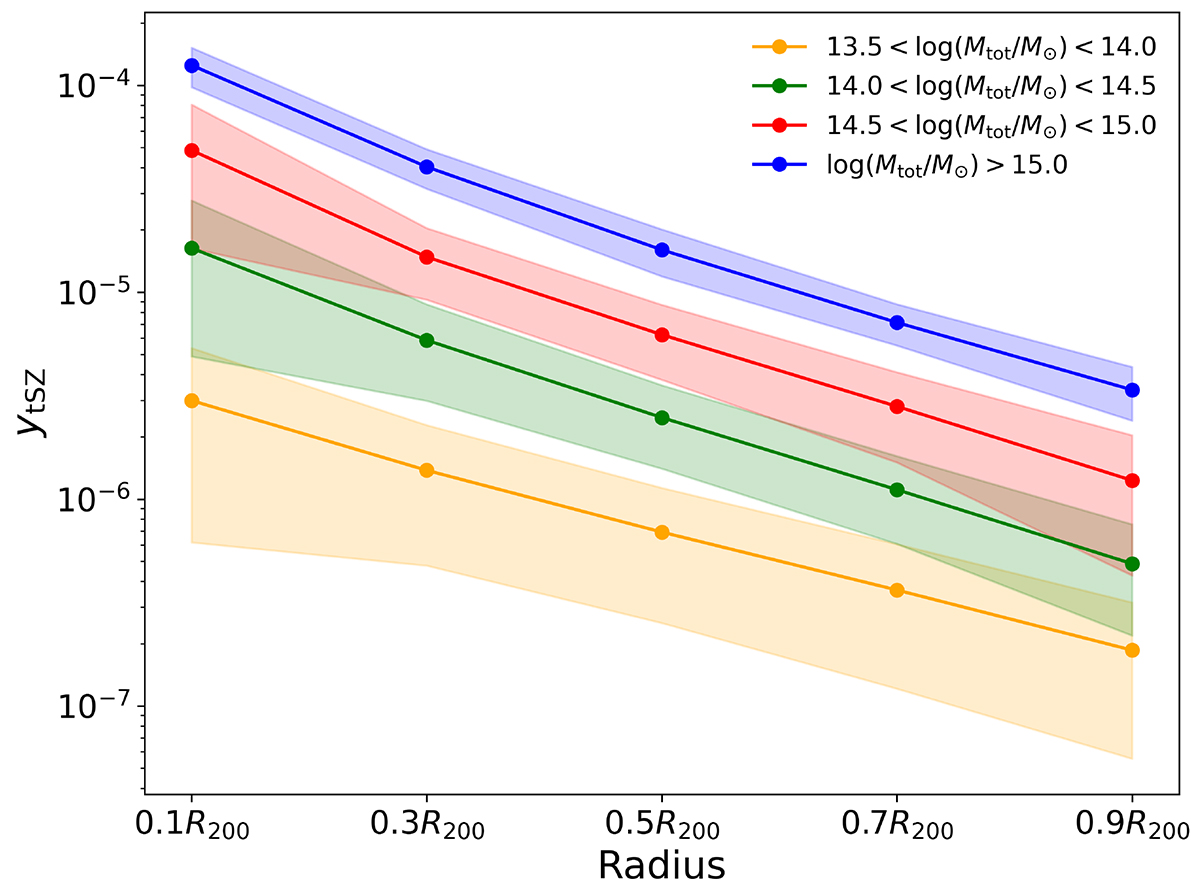
Radial profiles of the Compton ytSZ parameter for the four mass bins of our sample. The radii are normalized to R200 of the clusters. The lines represent the mean radial profile of ytSZ, and the shaded regions indicate the scatter.
Current usage metrics show cumulative count of Article Views (full-text article views including HTML views, PDF and ePub downloads, according to the available data) and Abstracts Views on Vision4Press platform.
Data correspond to usage on the plateform after 2015. The current usage metrics is available 48-96 hours after online publication and is updated daily on week days.
Initial download of the metrics may take a while.