Fig. 2.
Download original image
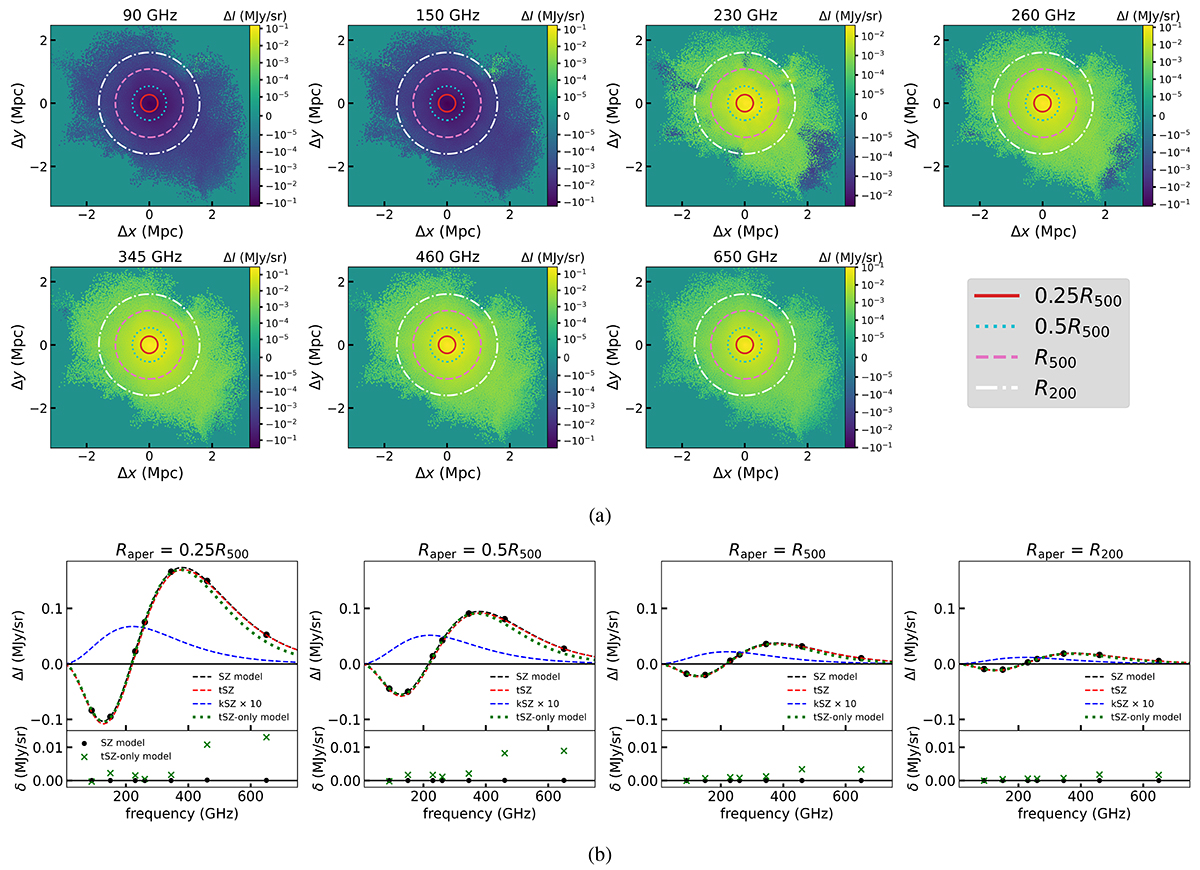
SZ effect of a galaxy cluster at various frequencies and the corresponding SZ spectra. Panel a: examples of the SZ effect of a galaxy cluster at various frequencies: 90 GHz, 150 GHz, 230 GHz, 260 GHz, 345 GHz, 460 GHz, and 650 GHz. The circles represent four different aperture sizes for photometry. The solid red circle corresponds to 0.25R500, the dotted cyan circle to 0.5R500, the dashed pink circle to R500, and the dash-dotted white circle to R200. Panel b: SZ spectra of the galaxy cluster in panel a measured at the cluster center using different aperture sizes of 0.25R500, 0.5R500, R500, and R200, corresponding to the circles in the SZ maps in panel a. The black dots represent the measured fluxes of the SZ effect at different frequencies. We fit the black dots with an analytic formula for the SZ effect (Nozawa et al. 2006). The dashed black lines show the results of fitting the total SZ signal, and the dashed red and blue lines represent the contributions from the tSZ and kSZ effects, respectively. The dotted green line corresponds to the best-fit result of the tSZ-only model. The residuals of the best-fit SZ model and the tSZ-only model with respect to the data are shown as black dots and green crosses in the bottom panels.
Current usage metrics show cumulative count of Article Views (full-text article views including HTML views, PDF and ePub downloads, according to the available data) and Abstracts Views on Vision4Press platform.
Data correspond to usage on the plateform after 2015. The current usage metrics is available 48-96 hours after online publication and is updated daily on week days.
Initial download of the metrics may take a while.