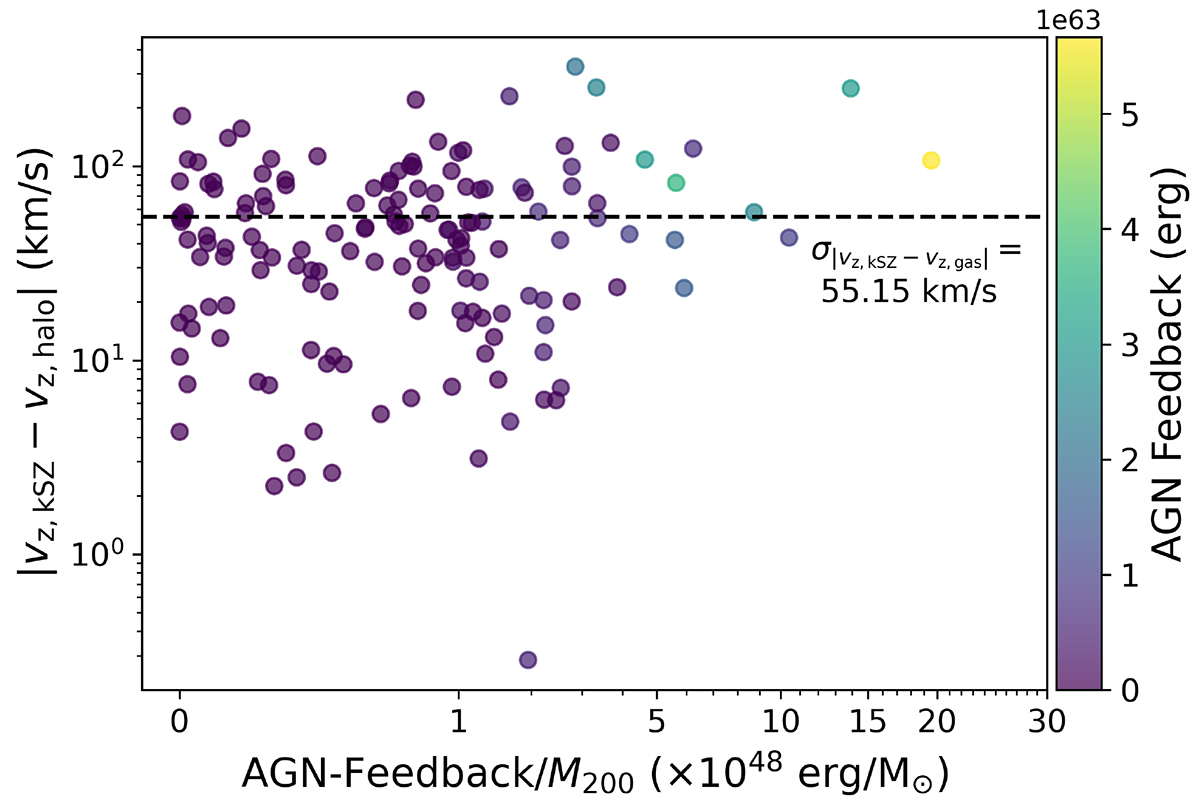
Fig. 12.
Download original image
Distribution of |vz, kSZ − vz, halo| against the ratios of total cumulative AGN feedback to M200 of galaxy clusters in our sample for measurements with Raper = R200. The dashed line represents the rms scatter (∼55.15 km s−1) of the vz, kSZ = vz, gas line at a given x-axis for all galaxy clusters based on measurements using apertures of R200, as shown in Figure 8. The color bar represents the AGN feedback of the galaxy clusters.
Current usage metrics show cumulative count of Article Views (full-text article views including HTML views, PDF and ePub downloads, according to the available data) and Abstracts Views on Vision4Press platform.
Data correspond to usage on the plateform after 2015. The current usage metrics is available 48-96 hours after online publication and is updated daily on week days.
Initial download of the metrics may take a while.