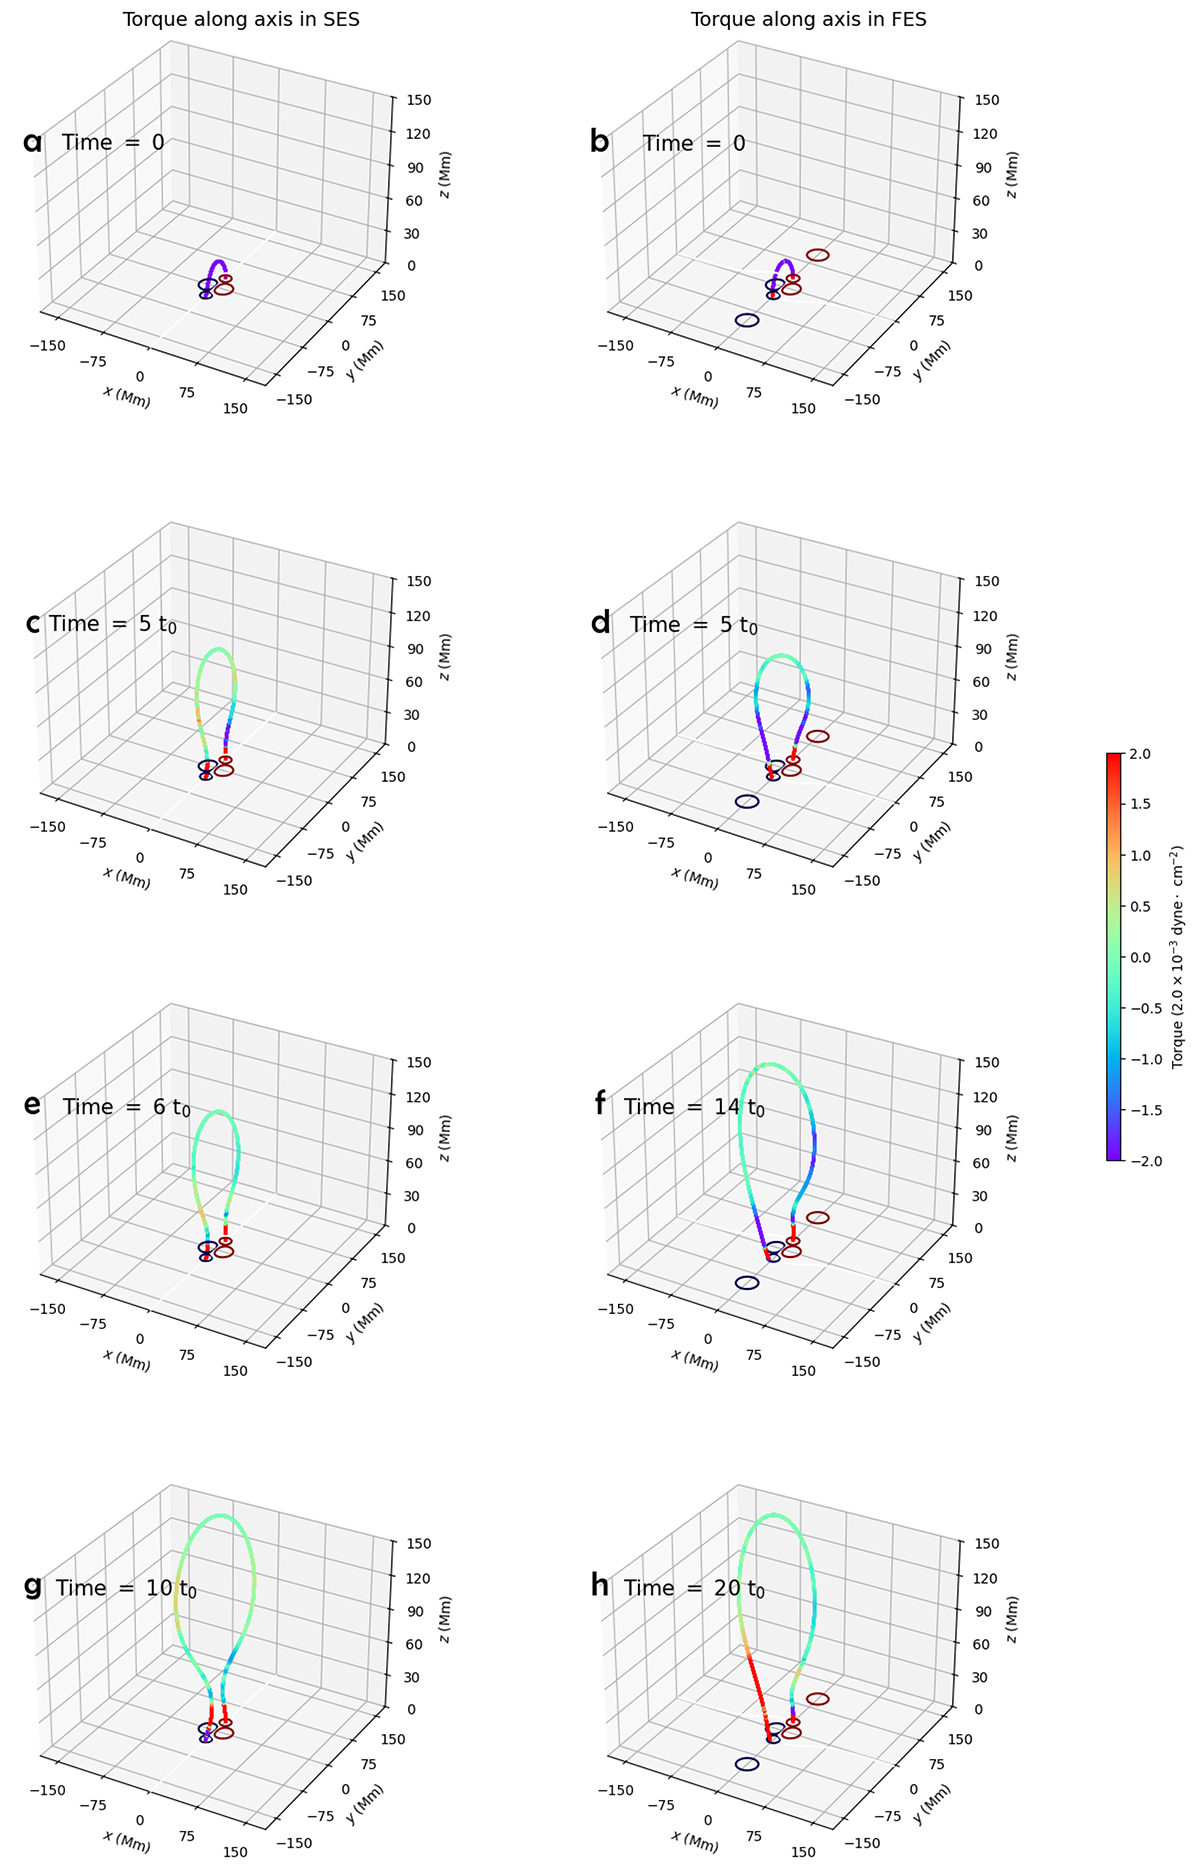
Fig. A.1.
Download original image
Torque distribution along the axis at (a) t = 0, (c) t = 5 t0, (e) t = 6 t0, and (g) t = 10 t0 in SES, and (b) t = 0, (d) t = 5 t0, (f) t = 14 t0, and (h) t = 20 t0 in FES, where the positive (negative) torque promotes the counterclockwise (clockwise) rotation is shown in red (purple). In all panels, the magnetic contours of +20 Gauss (dark red) and -20 Gauss (dark blue) are superimposed on the bottom plane. The white lines show polarity inversion lines in each panel. An animation showing the above evolutions is available online.
Current usage metrics show cumulative count of Article Views (full-text article views including HTML views, PDF and ePub downloads, according to the available data) and Abstracts Views on Vision4Press platform.
Data correspond to usage on the plateform after 2015. The current usage metrics is available 48-96 hours after online publication and is updated daily on week days.
Initial download of the metrics may take a while.