Fig. 7.
Download original image
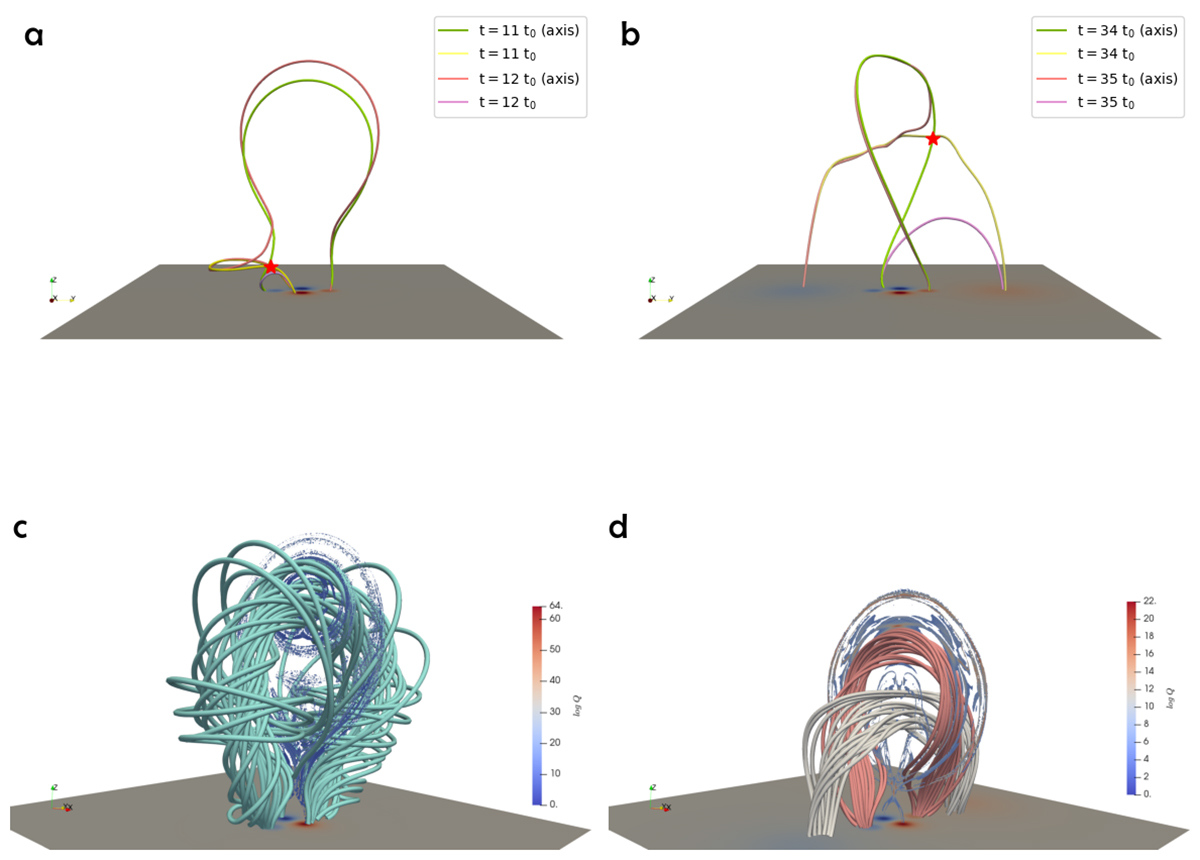
Magnetic field configuration changed by magnetic reconnection. In panels (a) and (b), field lines at two adjacent simulation times are selected to show the axis deformation caused by magnetic recconection in the second stage. The green (the former axis) and yellow lines represent field lines before the reconnection, while the red (the later axis) and plum lines represent field lines after reconnection. The reconnection location is marked by a red star. The two adjacent times in panel (a) are t = 11 t0 and t = 12 t0 in SES, and in panel (b), they are t = 34 t0 and t = 35 t0 in FES. MFRs at t = 10 t0 with QSL contours in xOy and xOz slices are shown in panel (c) in SES and in panel (d) in FES, where the cyan and red lines represent the original RBSL MFR, and the gray lines in panel (d) show the newly formed MFR in FES.
Current usage metrics show cumulative count of Article Views (full-text article views including HTML views, PDF and ePub downloads, according to the available data) and Abstracts Views on Vision4Press platform.
Data correspond to usage on the plateform after 2015. The current usage metrics is available 48-96 hours after online publication and is updated daily on week days.
Initial download of the metrics may take a while.